

You're halfway through a question block, you hit a 2×2 table, and the whole stem suddenly feels heavier than pharmacology ever did. That reaction is normal, because biostats on USMLE Step 1 asks you to do three things at once, read the study, translate the numbers, and decide what the exam wants. The good news is that the subject is learnable when you treat it as a reasoning system, not a memory test.
Why Biostats Feels Hard on Step 1
The first reason biostats feels slippery is that it looks like math, but it's really a reading test with numbers attached. A lot of students can recite formulas in isolation, then freeze when a vignette hides the clue in the study design, the denominator, or the wording of the outcome. That mismatch is exactly why a calm, repeatable workflow matters more than raw speed.
The second reason is that biostatistical notation is unfamiliar to many pre-clinical curricula. Sensitivity, specificity, predictive values, likelihood ratios, confidence intervals, and study designs each live in a different part of the mental map, so they blur together under pressure. If you try to memorize everything as separate facts, the details compete with one another instead of supporting each other.
The third reason is that Step 1 biostats is not just about recall anymore. USMLE's current content outline places biostatistics and epidemiology/population health at 4–6% of the exam (USMLE Step 1 content outline), and the post-pass/fail format changed how students approach the material. Since Step 1 became pass/fail on January 26, 2022, with a 196 passing standard on the old three-digit scale and no reported numeric score, interpretation matters more than score-chasing (USMLE scoring update, USMLE examination results and scoring).
Practical rule: if a biostats question feels abstract, turn it back into a study question, ask who was tested, what the outcome was, and what changed when the test result changed.
A useful way to think about biostats USMLE Step 1 is as a toolkit you can build in layers. First comes the 2×2 table. Then you separate test characteristics from predictive values. After that, you connect likelihood ratios to Bayes-based reasoning, then move to study design, and finally to confidence intervals, p values, and hypothesis testing. That sequence keeps the formulas from blurring into one another.
Active recall helps this kind of learning stick because it forces retrieval, not recognition. A simple place to start is this active recall approach for medical students, then use biostats practice questions to rehearse the same logic under time pressure. With focused repetition, this subject becomes procedural instead of mysterious.
Sensitivity Specificity and Predictive Values
A student usually learns this topic fastest when the table is tied to an actual disease example. Take a screening test for mitral stenosis in a moderately prevalent adult population. Once you label the diseased and non-diseased groups, the 2×2 table stops being abstract and starts behaving like a map.
The two numbers that stay fixed
Sensitivity is the true positive rate among people who have the disease. Specificity is the true negative rate among people who do not. Those two are intrinsic test characteristics, so they do not change just because the setting changes.
That is the point where many students mix them up with predictive values. Positive predictive value (PPV) and negative predictive value (NPV) describe what a positive or negative result means in the tested population, so they shift with prevalence. The same test can look stronger in a cardiology referral clinic than in a low-risk primary care setting, because the mix of diseased and non-diseased people is different.
Memory hook: sensitivity and specificity describe the test, PPV and NPV describe the result in the population.
Here's the exam move. If a stem describes a high pre-test probability setting, mentally tilt the table toward disease before you answer. That often explains why a test with decent sensitivity still gives only a modest PPV when the disease is uncommon.
For a quick calculation, imagine a population where 10 of 100 screened patients have the disease, and the test has 80% sensitivity and 90% specificity. Among the 10 diseased patients, 8 test positive. Among the 90 non-diseased patients, 9 test positive because specificity is 90%. So PPV is 8 / 17, or about 47%. The arithmetic is simple once the table is labeled correctly.
The trade-off also matters. If a test becomes more sensitive, it usually loses specificity, which is why the mnemonics SnNout and SpPin still help. A highly sensitive test is good for ruling out disease when negative, and a highly specific test is useful for ruling in disease when positive. For biostats USMLE Step 1, that distinction shows up constantly in vignette language.
A helpful companion resource on interpreting negative predictive value is this explanation of NPV, especially if you keep reversing NPV and specificity under stress.
| Measure | Formula | Depends on Prevalence? | Mnemonic |
|---|---|---|---|
| Sensitivity | TP / (TP + FN) | No | SnNout |
| Specificity | TN / (TN + FP) | No | SpPin |
| PPV | TP / (TP + FP) | Yes | Result in the tested population |
| NPV | TN / (TN + FN) | Yes | Result in the tested population |
Likelihood Ratios and Bayes at the Bedside
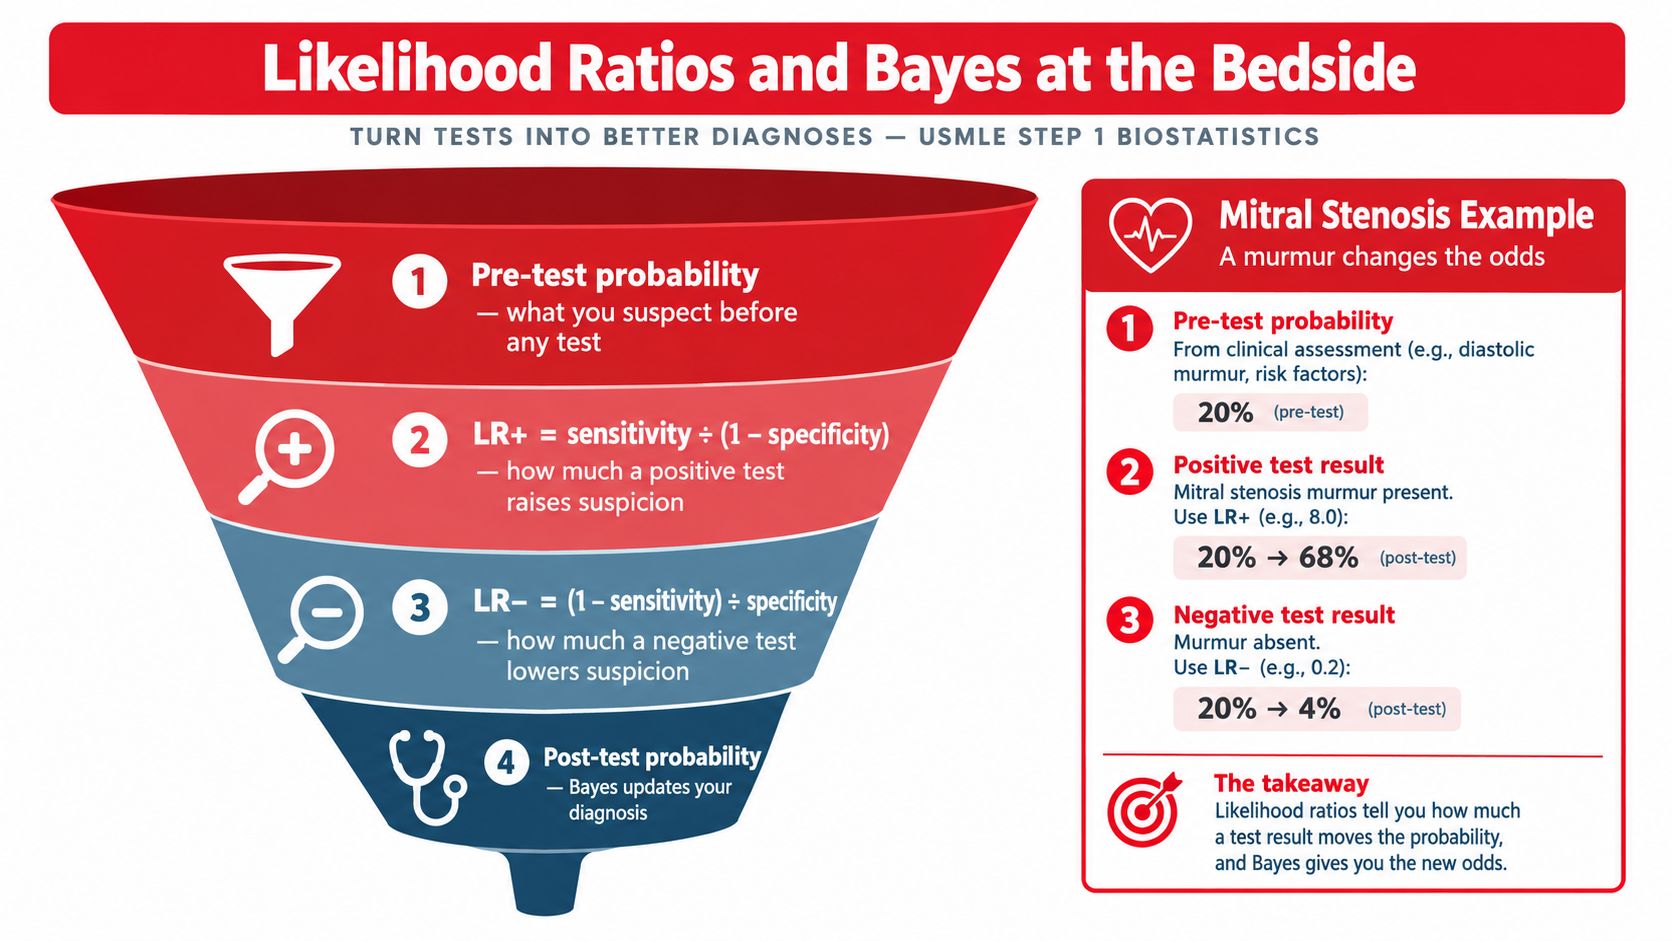
Likelihood ratios feel less intuitive at first, but they're often the cleanest way to think through a vignette. The core idea is simple. A test result changes what you think before the test into what you think after the test.
Reading LR+ and LR− without getting lost
The positive likelihood ratio (LR+) is sensitivity / (1 − specificity). The negative likelihood ratio (LR−) is (1 − sensitivity) / specificity (Bayes and likelihood ratio review). Unlike predictive values, likelihood ratios are prevalence-independent, which is why they're so useful when the stem doesn't give you a clean prevalence clue.
If you picture a Fagan nomogram, the logic is visual. Start on the left with the pre-test probability, draw a line through the LR in the middle, and land on the right at the post-test probability. That is just Bayes reasoning in a faster format.
Use the same mitral stenosis example. If pre-test probability is 30% and LR+ is 4.2, the post-test odds go up enough to land at roughly 65% post-test probability. If LR− is 0.3, the same pre-test probability drops to about 11% after a negative result. You do not need to love the arithmetic, but you do need to understand the direction of the shift.
A positive test with a strong LR+ can meaningfully raise suspicion, but only if you start with the right clinical context.
That context is what Step 1 often hides in the stem. A strong family history, a classic murmur, or a compatible exposure history increases pre-test probability before you touch the test result. Sequential reasoning matters too. Multiple findings stack, so a history clue, exam sign, and test result can each push probability further in the same direction.
The exam trap is treating an LR like a probability. It isn't. It's a multiplier that updates probability through odds. Once you see it that way, LR questions stop feeling like random algebra and start looking like structured clinical reasoning.
Study Designs Every Step 1 Student Must Recognize
The easiest way to miss a study design question is to memorize the label without the direction. Step 1 usually gives you a clue about where the investigators started, where they ended up, and what measure they can reasonably report. If you identify those three things, the answer usually opens up.
The five designs you should sort instantly
A randomized controlled trial (RCT) starts with exposure assignment and is strongest for limiting confounding. A prospective cohort starts with exposure and follows participants forward, often producing relative risk (RR). A retrospective cohort looks backward from existing records but still compares exposed and unexposed groups, so RR remains the main measure. A case-control study starts with outcome status and usually yields an odds ratio (OR). A cross-sectional study measures a population at one time point and often gives prevalence.
| Design | Direction | Measure | Bias Best Controlled | Typical Exam Cue |
|---|---|---|---|---|
| RCT | Exposure → outcome | RR, absolute risk | Confounding | Random assignment, intervention trial |
| Prospective cohort | Exposure → outcome | RR | Selection bias better than case-control | Follow-up over time |
| Retrospective cohort | Exposure → outcome, using existing data | RR | Confounding limited by design quality | Chart review with exposed vs unexposed |
| Case-control | Outcome → exposure | OR | Efficient for rare outcomes | Start with disease cases |
| Cross-sectional | Single time point | Prevalence | Descriptive, not causal | Snapshot survey |
The odds ratio can exaggerate risk when outcomes are common, which is why you should not casually treat it like RR. If a vignette compares a drug with RR of 0.6 in an RCT against an exposure with OR of 2.1 in a case-control study, the numbers are not interchangeable. The design tells you what the measure means.
Step 1 also likes the hierarchy of evidence. At the top are well-done randomized trials and systematic reviews with meta-analysis, then cohort and case-control studies, then case series and expert opinion. That hierarchy is about internal validity and causal strength, not about whether a study feels impressive.
The newer pattern students notice is that genetic association studies and large registry cohorts show up more often than classic textbook case-control vignettes. Meanwhile, ecological, cross-over, and before-after designs tend to live more in research vocabulary than in everyday Step 1 testable logic, even though you should still recognize them when they appear. If you want a broader epidemiology review alongside these patterns, this epidemiology resource is a natural companion.
A 60-second recall prompt helps here:
- Start point: exposure, outcome, or time zero?
- Measure: RR, OR, or prevalence?
- Best control: confounding, selection, or recall?
- Cue words: randomized, followed, surveyed, or compared after diagnosis?
Confidence Intervals P Values and Hypothesis Testing
When a stem gives you a p value or confidence interval, it is really asking whether the result is precise enough and strong enough to trust. A lot of students overfocus on the threshold and ignore what the estimate actually says. That is where the points leak.
The four sentences you should be able to defend
The null hypothesis says there is no meaningful difference between groups. The alternative hypothesis says there is a difference. A 95% confidence interval is the range that would capture the true effect in repeated samples about 95 times out of 100, and a p value is the probability of seeing data this extreme if the null were true. For a compact visual version, the confidence intervals guide is a useful reference when you want another explanation of width and precision.
If a trial compares two antihypertensives and reports a relative risk of 0.75 with a 95% CI of 0.60 to 0.93, the CI stays entirely below 1.0, so the result is statistically significant. If the CI crosses 1.0, the effect may still exist, but the data do not give you enough certainty to claim it confidently. That null value matters because ratios use 1 as the reference point, while differences use 0.
The error terms matter too. Type I error is a false positive, or rejecting a true null. Type II error is a false negative, or missing a real effect. Power is 1 minus beta, so it's the chance the study detects an effect if one truly exists.
Here's the part students often miss. A non-significant p value does not prove there is no effect. It can also mean the study was underpowered, the sample was too small, or the estimate was too imprecise to separate signal from noise. In other words, you read the p value together with the CI, not alone.
| Concept | Plain meaning | Step 1 cue |
|---|---|---|
| Null hypothesis | No difference | Compare against 0 or 1 |
| Alternative hypothesis | A difference exists | Two-sided or one-sided framing |
| 95% CI | Range of plausible effects | Width shows precision |
| p value | Data extreme under null | Small p supports rejection, not certainty |
A good way to keep the logic straight is to link statistics back to decision-making. If the CI is narrow and excludes the null, the estimate is more precise. If it's wide and crosses the null, the safest answer is usually that evidence is insufficient, not that the intervention definitely failed.
For a broader walk-through of this topic, this confidence intervals article also shows how the exam frames study design and interpretation in vignette form.
Common Biostats Traps and How to Dodge Them
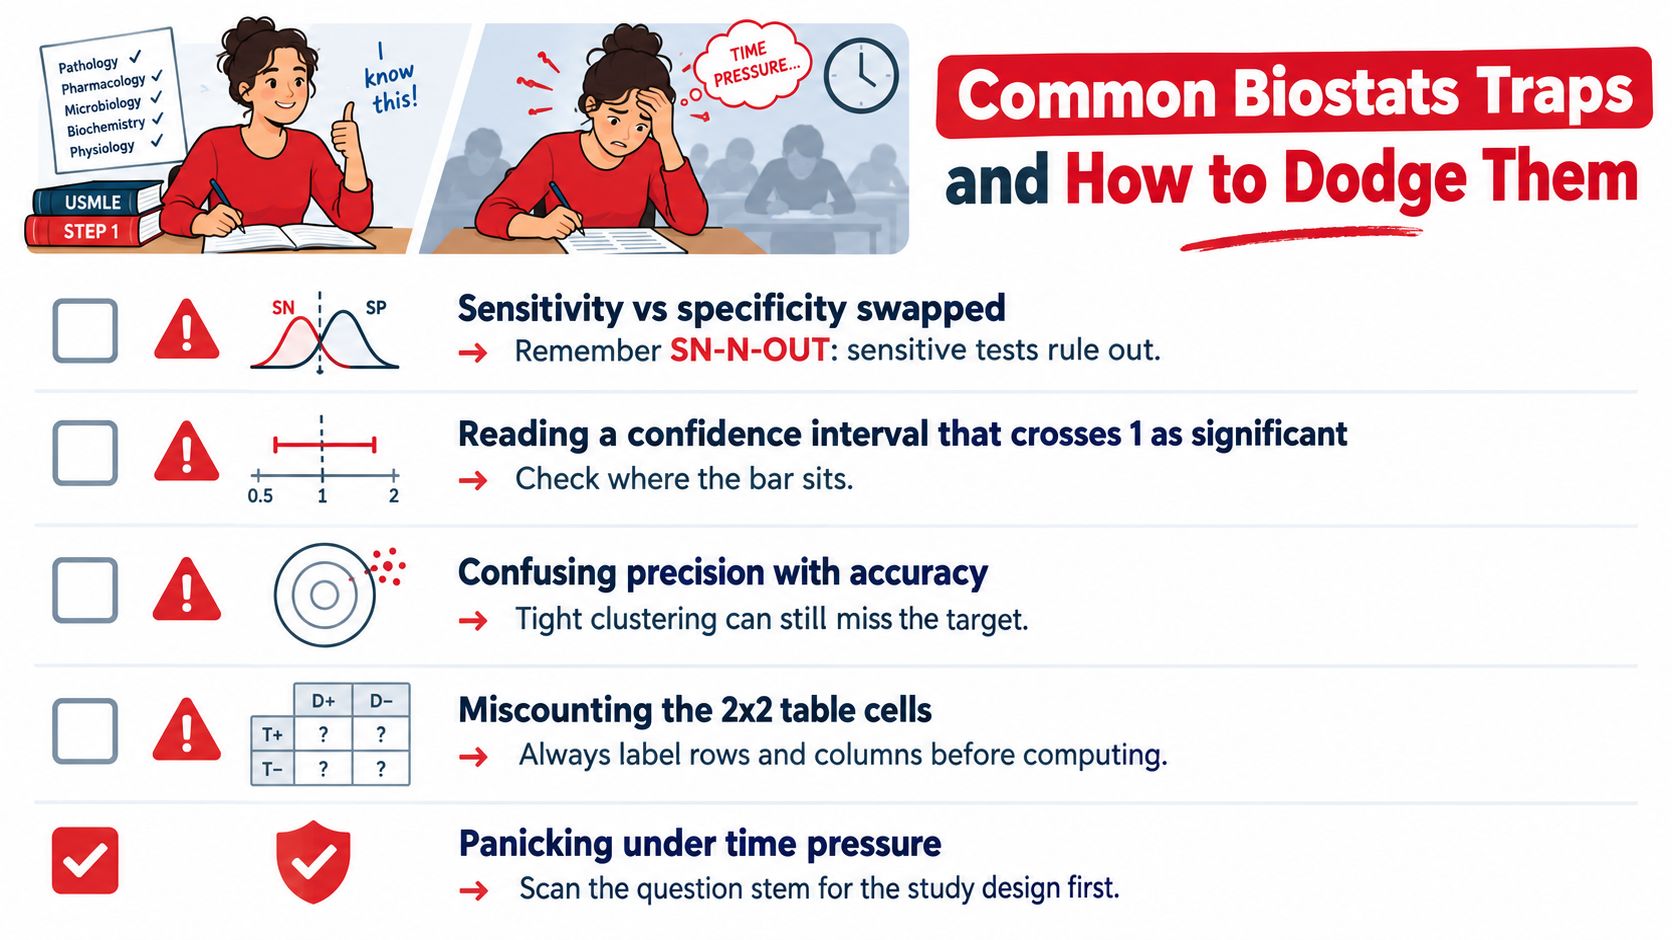
A student can understand every formula in isolation and still miss points because the question stem is built to reward careful reading. The mistake usually isn't arithmetic. It's assuming the first familiar-looking term is the right one.
The mistakes that keep repeating
The most common trap is confusing PPV with sensitivity. PPV changes with prevalence, so a high-risk clinic and a low-risk screening setting do not behave the same way. If you do not restate prevalence before answering, you're already in danger.
Another trap is mixing up NPV and specificity. Specificity is about the non-diseased population and the test itself, while NPV depends on how common disease is in the tested group. That sounds small, but it changes the answer fast.
The third trap is treating LR+ like a probability. It is not a percentage and not a risk, it is a multiplier. If you catch yourself saying “a 4.2 LR means 4.2%,” stop and go back to the question stem.
The fourth trap is reading “no difference” as the same thing as equivalence. A study can be non-significant and still be too imprecise to say the treatments are equal. That's why the CI matters more than the slogan.
The fifth trap is assuming a wider confidence interval always means weaker evidence in every sense. Wider CIs do mean less precision, but the key decision still depends on where the interval sits relative to the null and whether the outcome is clinically important.
| Trap | Quick audit check |
|---|---|
| PPV vs sensitivity | State the prevalence before you compute anything |
| NPV vs specificity | Ask whether you're describing the test or the result |
| LR+ as probability | Replace percent language with multiplier language |
| “No difference” = equivalence | Circle whether the CI includes the null |
| Wide CI = meaningless | Check both precision and clinical relevance |
Five-second check: label the denominator first, then ask whether the measure belongs to the test, the result, or the study design.
A student who slows down for ten seconds often saves a point. The stem usually contains the answer key in disguise, especially if you identify the study type, the denominator, and the null value before touching the math. That tiny pause is often enough to turn a misread into a correct answer.
Study Plan Question Review and FAQs
A strong biostats plan does not need to be complicated. It needs repetition, error logging, and enough variety that the same idea shows up in different disguises. Four weeks is enough for most students to build that rhythm if they review questions deliberately instead of just doing more of them.
A simple four-week structure
| Week | Focus Topics | Question Bank Blocks | Weekly Review Task |
|---|---|---|---|
| 1 | 2×2 tables, sensitivity, specificity, PPV, NPV | Short mixed biostats sets | Rewrite every missed explanation in plain language |
| 2 | Likelihood ratios, Bayes reasoning, pre-test probability | Vignette-heavy sets | Tag each miss by numerator, denominator, or prevalence error |
| 3 | Study design, bias, p values, confidence intervals | Mixed epidemiology and stats blocks | Build a one-page error log of recurring traps |
| 4 | Hypothesis testing, power, modern topic review | Timed mixed blocks | Rework incorrect items without looking at the answer key |
A good review workflow is short and disciplined. Tag each missed item as test characteristics, study design, inference, or trap. Then rewrite the explanation in your own words, because if you can't restate it cleanly, you probably don't own it yet. That is also the place to compare your answer to a structured resource like how to study for USMLE Step 1, especially if your current plan is too scattered.
Modern biostats topics can also show up unevenly in prep materials. A recent review found that one-fifth of biostatistical domains were omitted across examined study resources, including multilevel regression modeling and data weighting, and 63% of reviewed articles used methods not covered in any of those resources (Family Medicine review). That does not mean you need to master research methods in full, but it does mean you should be ready to recognize what is testable versus what belongs more to research literacy.
FAQs
Do linear and logistic regression appear on Step 1?
They can appear as concepts, especially in how you interpret adjustment or association, but they are not usually the centerpiece of the question.
How are meta-analysis and forest plots tested?
Usually as interpretation questions, especially about overall effect, confidence intervals, and consistency across studies rather than the mechanics of the plot itself.
When should I recognize intention-to-treat versus per-protocol analysis?
When a question asks which analysis best preserves randomization or gives the most decision-relevant estimate, intention-to-treat is usually the safer Step 1 answer.
Does pass/fail Step 1 make biostats less important?
No. It changes the score-reporting context, but biostats still sits inside the tested content and still matters for broader exam performance, especially because the exam remains criterion-referenced with a defined passing standard (USMLE scoring update).
Can a tutoring option help with biostats?
Yes, if it focuses on question analysis and error patterns rather than replacing official practice materials. One option that works in that model is Ace Med Boards, which offers USMLE Step 1 tutoring and biostatistics-focused support.
If you want a calmer way to clean up biostats before your next exam block, use this article as your review map, then work through a timed question set and an error log in the same sitting. For students who want guided review of Step 1 reasoning, Ace Med Boards offers one-on-one tutoring that can be used to organize biostatistics, study design, and question analysis around the exact mistakes you keep repeating.