The Number Needed to Treat, or NNT, is one of the most practical stats you'll ever learn in medicine. Forget abstract percentages for a moment. NNT answers a simple, crucial question: "For this specific treatment, how many people do we need to give it to prevent one bad thing from happening?"
A lower NNT means a more powerful intervention. Why? Because you have to treat fewer people to see one successful result. It’s a game-changing number that cuts through the noise of clinical trial data and gives you a real-world measure of a drug or procedure's impact.
Decoding NNT: A Practical Introduction
Imagine you're a resident deciding if a new cholesterol drug is worth prescribing over the standard one. You dig into a recent study and find the new drug has an NNT of 25 to prevent one heart attack over five years.
What does that actually mean? It means you'll have to treat 25 patients with this new medication for five years to stop just one heart attack that wouldn't have been prevented otherwise. That single number gives you an immediate sense of the effort versus the reward.
This is the real power of the NNT. It moves you past fuzzy statistics like relative risk reduction and gives you something tangible you can use to make clinical decisions and talk to patients.
Why Mastering NNT Is a Must
For anyone prepping for the USMLE or COMLEX, NNT isn't just a "nice-to-know" concept—it's high-yield, bread-and-butter material. But beyond the boards, truly getting it makes you a better clinician.
Grasping NNT allows you to:
- Communicate Clearly With Patients: You can skip the jargon. Instead of saying a drug is "30% more effective," you can put it in real terms: "For every 25 people like you who take this medication for five years, we can prevent one person from having a stroke." Patients get that.
- Critically Appraise Research: You can quickly cut to the chase and see the real-world significance of a study's results. A massive relative risk reduction might sound impressive, but if it translates to an NNT of 250, you know the treatment's actual clinical benefit is pretty small.
- Make Sharper Clinical Decisions: It helps you weigh the pros and cons. You can compare the NNT of a new treatment against its cost, side effects (which we'll cover with NNH), and the hassle for the patient. It’s a key part of making smart, evidence-based choices.
In short, the Number Needed to Treat bridges the huge gap between the statistical results of a clinical trial and the individual patient sitting across from you. It answers the question, "So what? How much good is this treatment actually doing?" Acing your exams and practicing thoughtful medicine demands you know it inside and out.
Calculating the Number Needed to Treat Step by Step
To really get what Number Needed to Treat means, you have to know how to calculate it from the raw data you'll see in clinical trials. The math itself is pretty simple, but it’s built on a few core concepts that show you a treatment's real-world impact. Nailing this process down is essential for your exams and for sizing up new research on the fly.
The path to finding the NNT starts with two key numbers you’ll find in almost any study abstract: the Control Event Rate (CER) and the Experimental Event Rate (EER).
- Control Event Rate (CER): This is just the percentage of patients in the control group (the ones who got a placebo or the old standard of care) who had the bad outcome we're trying to prevent.
- Experimental Event Rate (EER): This is the same thing but for the treatment group—the percentage of patients who got the new intervention and still had the bad outcome.
This flowchart breaks down the basic idea: a bunch of patients get a treatment, and for some of them, it leads to a successful outcome.
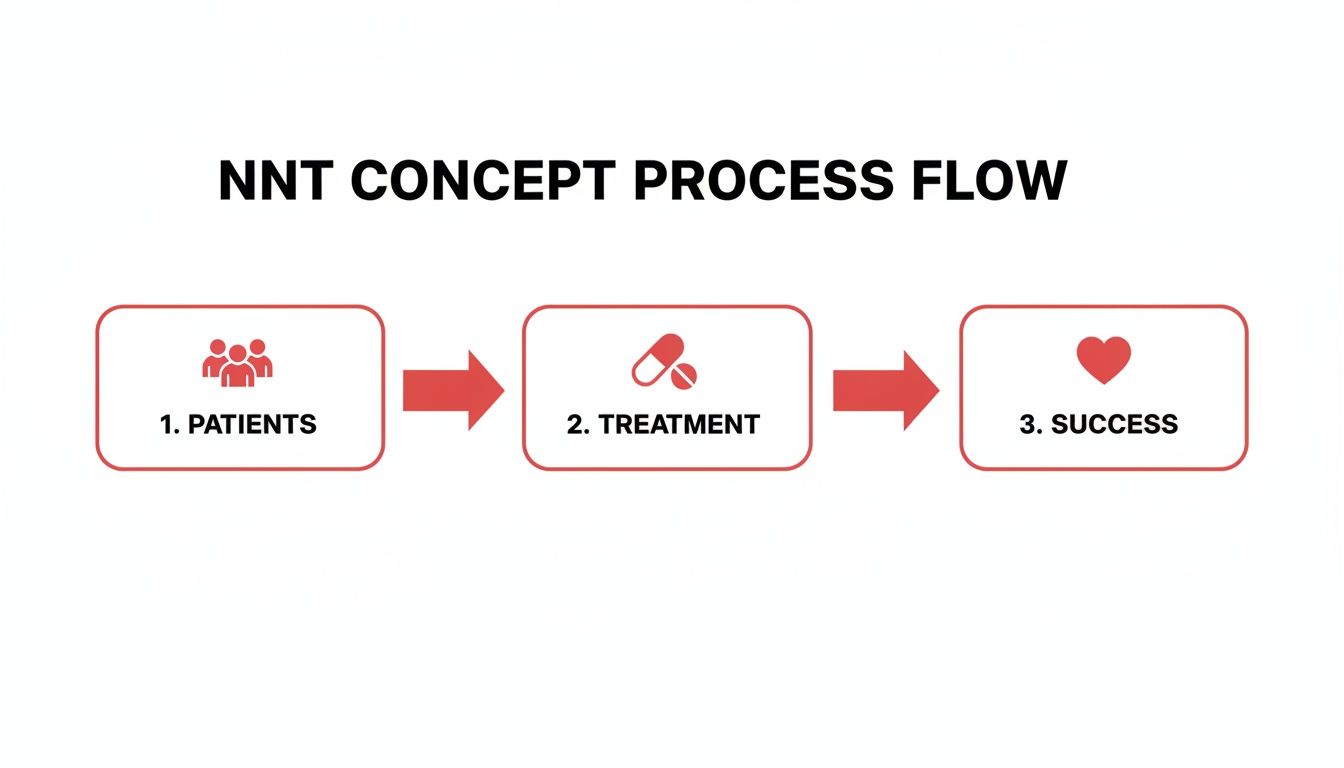
The visual makes it clear: NNT is all about figuring out the clinical effort it takes to get one single positive result in a population.
Finding the Absolute Risk Reduction
Next up, you need to calculate the Absolute Risk Reduction (ARR). This is a big one. Unlike relative measures, which can sometimes make a treatment look more impressive than it is, ARR gives you the actual difference in risk between the two groups. It's the most critical piece of the puzzle for finding the NNT.
The formula couldn't be easier: ARR = CER – EER
This number tells you the real percentage of the patient population spared from the adverse outcome because they got the new treatment. Just like with other clinical calculations, such as figuring out the anion gap in metabolic acidosis, getting the basics right is everything. You can check out our guide on how to calculate anion gap for more on that kind of diagnostic thinking.
Often, you'll need to do some basic math like converting fractions into decimals to get your ARR, which is a key step for NNT. For quick conversions, a Fraction To Decimal Calculator can be handy.
The Final Step: The NNT Formula
Once you’ve got your ARR, the last step is a breeze. The Number Needed to Treat is just the reciprocal of the Absolute Risk Reduction.
NNT = 1 / ARR
This simple flip turns the risk reduction percentage into a concrete number of patients. It finally answers the ultimate clinical question: how many people do we have to give this treatment to in order to prevent one extra bad thing from happening?
Think about it: a tiny ARR (meaning a very small difference between the treatment and control groups) will give you a huge NNT, telling you the intervention isn't very efficient. On the flip side, a large ARR means you'll get a small, much more impressive NNT.
Interpreting NNT in a Clinical Context
Calculating the Number Needed to Treat is only half the battle. The real skill—the part that separates the statisticians from the clinicians—is figuring out what that number actually means for the patient sitting in front of you.
On the surface, the rule is simple: a lower NNT is generally better. It just feels more powerful. An NNT of 5 means you only need to treat five patients to stop one bad thing from happening. Compare that to an NNT of 50, and the first option seems like a clear winner.
But a raw number without context is just trivia. True understanding demands you dig deeper into the clinical scenario. This is a core part of building strong clinical reasoning, moving you from someone who can plug numbers into a formula to a physician who can critically appraise medical evidence.
The art of interpreting NNT is not just about the number itself, but about the story it tells. It forces you to ask critical questions: What outcome are we preventing? Over what period? And for whom?
The Importance of Clinical Context
The "value" of an NNT is completely relative. A high NNT might be incredible, and a low one could be a total dud. It all depends on the situation. Three factors are absolutely critical for making a sound judgment:
- Severity of the Outcome: Preventing a mild headache is a world away from preventing a fatal stroke. You'd jump at the chance to prescribe a safe, cheap pill with an NNT of 100 if it prevented one death. On the other hand, you might think twice about a risky, expensive therapy with an NNT of 10 if all it did was prevent mild nausea.
- Timeframe of the Study: An NNT is always tied to a specific duration. An NNT of 20 over six months is a very different beast than an NNT of 20 over ten years. Shorter timeframes for the same NNT value point to a much more potent and rapidly effective intervention.
- Patient's Baseline Risk: This is huge. NNT is completely dependent on the risk profile of the population being studied. Why? Because a treatment will naturally have a lower (better) NNT in a high-risk group where there are simply more bad outcomes to prevent in the first place.
Understanding Confidence Intervals
Any NNT you see calculated from a study is just a point estimate—it's the single "best guess" from that particular dataset. But the true value in the wider world could be a bit different.
This is where the 95% confidence interval (CI) comes in. The CI gives you a range of plausible values for the NNT, giving you a feel for the statistical muscle behind the result.
For example, an NNT of 15 with a 95% CI of 10-25 is a pretty solid finding. The range is reasonably tight, telling you the true NNT is very likely somewhere between 10 and 25. You can be confident in that result.
Now, contrast that with an NNT of 15 with a 95% CI of 2-150. This is a much shakier finding. The ridiculously wide range screams statistical uncertainty. It suggests the treatment could be a blockbuster (NNT of 2) or it could be practically useless (NNT of 150). Always, always look for the confidence interval to see if an NNT is truly reliable.
Weighing Benefits and Harms with NNT and NNH
No treatment is a magic bullet. Every potential benefit we offer our patients comes with a potential risk, and making a smart clinical decision means looking at both sides of that coin. This is where the Number Needed to Treat finds its essential partner: the Number Needed to Harm (NNH).

Simply put, the NNH tells you how many people you need to treat for one extra person to experience a specific side effect or adverse event. It’s the flip side of the NNT coin, giving us a hard number for the potential downsides.
Calculating and Comparing Harm
The NNH calculation is a mirror image of the NNT formula. Instead of using Absolute Risk Reduction, we use the Absolute Risk Increase (ARI). This is just the difference in the rate of a bad outcome between the treatment group and the control group.
The ideal therapy is one with a low NNT (meaning it’s highly effective) and a high NNH (meaning it’s very safe). This simple framework is the core of evidence-based, shared decision-making with patients.
Putting these two numbers side-by-side gives you a powerful, at-a-glance risk-benefit analysis. A new drug might have a fantastic NNT for preventing heart attacks, but what if its NNH for causing a major bleed is nearly the same? Suddenly, the clinical choice gets a lot tougher.
This is a classic medical dilemma—managing one problem might introduce another, like when a life-saving medication is tough on the kidneys. It’s the same kind of clinical balancing act we use when considering the indications for dialysis.
We see this trade-off all the time. For example, studies on antipsychotics like olanzapine found an NNT of 5 for preventing relapse, but an NNH of just 9 for causing significant weight gain. A review of opioids for chronic pain showed an NNT of 12 to achieve 50% pain relief, but a much lower NNH of only 6 for causing vomiting. Understanding this trade-off has been critical for developing safer prescribing guidelines.
Ultimately, comparing NNT and NNH helps us answer the single most important question for any patient: "Is this treatment worth it for me?" By laying out both the likelihood of benefit and the likelihood of harm, you can have a truly transparent conversation that empowers patients to make choices that align with their own values and risk tolerance.
Applying NNT with High-Yield Board Exam Examples

Okay, theory is great, but board exams are a different beast entirely. They demand you take these concepts and apply them accurately—and fast—under immense pressure. Let's walk through a couple of realistic, high-yield clinical vignettes to build that exam-day muscle memory.
We'll work from the raw data all the way to a full clinical interpretation, just like you’ll have to do on the USMLE or COMLEX.
Example 1: Cardiology Statin Trial
You're presented with a randomized controlled trial for a new statin, "CardioGuard," aimed at the primary prevention of major adverse cardiac events (MACE) in high-risk patients over five years. The study enrolled 2,000 patients, splitting them evenly between the treatment and placebo groups.
Here are the top-line results:
- CardioGuard Group: 50 patients experienced MACE.
- Placebo Group: 80 patients experienced MACE.
Your job is to calculate and interpret the Number Needed to Treat (NNT) to prevent one MACE event. Let's break it down.
Step-by-Step Solution:
First, find the event rates for each group.
- Experimental Event Rate (EER) = 50 MACE / 1,000 patients = 0.05 (or 5%)
- Control Event Rate (CER) = 80 MACE / 1,000 patients = 0.08 (or 8%)
Next, calculate the Absolute Risk Reduction (ARR). This is the real-world difference the drug makes.
- ARR = CER – EER
- ARR = 0.08 – 0.05 = 0.03 (or 3%)
Finally, calculate the Number Needed to Treat (NNT). Just flip the ARR.
- NNT = 1 / ARR
- NNT = 1 / 0.03 = 33.33, which we'll round up to the nearest whole person, 34.
Clinical Interpretation: You need to treat 34 high-risk patients with CardioGuard for five years to prevent one additional major adverse cardiac event. This single number gives us a powerful snapshot of the drug's real-world efficiency.
Example 2: Infectious Disease Antibiotic Trial
Now for a slightly different scenario. A new antibiotic, "PulmoClear," is being tested to prevent post-operative pneumonia. The trial includes 400 high-risk surgical patients, with 200 receiving PulmoClear and 200 receiving a placebo.
During the study, an adverse event is noted: in the PulmoClear group, 30 patients develop a serious rash. In the placebo group, only 10 patients develop a similar rash.
Your task is to calculate the Number Needed to Harm (NNH) for causing a serious rash.
Step-by-Step Solution:
Calculate the adverse event rates.
- Treatment Group Harm Rate = 30 rashes / 200 patients = 0.15 (or 15%)
- Control Group Harm Rate = 10 rashes / 200 patients = 0.05 (or 5%)
Find the Absolute Risk Increase (ARI). This is the flip side of ARR.
- ARI = (Harm Rate in Treatment Group) – (Harm Rate in Control Group)
- ARI = 0.15 – 0.05 = 0.10 (or 10%)
Calculate the Number Needed to Harm (NNH).
- NNH = 1 / ARI
- NNH = 1 / 0.10 = 10
Clinical Interpretation: For every 10 patients treated with PulmoClear, one additional person will develop a serious rash who would not have otherwise. This NNH is a critical piece of the puzzle. It has to be weighed directly against the drug's NNT for preventing pneumonia to make an informed clinical decision.
This benefit-versus-harm dynamic is everywhere in medicine. A recent analysis of GLP-1 agonists, for instance, found an impressive NNT of 22 to prevent kidney disease progression. That's a powerful benefit, but it must always be considered alongside cost and any potential harms.
Mastering these examples solidifies your ability to interpret what is number needed to treat in the real-world contexts you'll face on your exams and in the clinic.
Common Mistakes to Avoid When Using NNT
The Number Needed to Treat is an incredibly practical metric, but its true power comes from using it correctly. Getting this wrong can lead to some seriously flawed clinical judgments. Honestly, understanding the limitations of NNT is just as critical as knowing how to calculate it.
One of the biggest and most common mistakes is comparing NNT values from different clinical trials. I get it, it's tempting to see an NNT of 5 for a drug in one study and an NNT of 20 in another and declare the first drug a winner. But this is a dangerous shortcut. An NNT isn't some universal constant for a drug; it's completely tied to the specific context of the study it came from.
You absolutely cannot compare NNTs without considering these factors:
- Different Baseline Risks: A trial testing a new statin in a population of patients with a prior heart attack (high-risk) will almost always have a lower, better-looking NNT than a trial testing it in healthy adults (low-risk). Why? There are simply more heart attacks to prevent in the first group.
- Varying Study Durations: An NNT of 20 over ten years means something completely different than an NNT of 20 over one year. The timeframe is baked into the statistic, and you can't just ignore it.
- Dissimilar Patient Populations: Think about it—differences in age, comorbidities, or how sick the patients are at the start of a trial can dramatically change the final NNT. A drug might work wonders in 60-year-olds but do very little for 80-year-olds.
NNT vs. Relative Risk Reduction
Another classic pitfall is getting dazzled by Relative Risk Reduction (RRR) while ignoring the NNT. Drug companies love to advertise with RRR because it can make a tiny benefit sound incredibly impressive.
For instance, a new drug might reduce the risk of a rare side effect from 0.2% to 0.1%. The marketing team will shout from the rooftops that it causes a 50% RRR—and they're not wrong! But let's ground that in reality. The Absolute Risk Reduction (ARR) is a minuscule 0.1%. Run the numbers, and you get an NNT of 1,000.
This means you’d have to treat a thousand people to prevent just one of those rare side effects. The NNT cuts through the statistical hype and gives you a much more sober, clinically relevant perspective.
Always, always prioritize NNT over RRR for actual clinical decision-making. NNT forces the conversation into the reality of practice: "How many of my actual patients do I need to put on this medication to see one person benefit?" It strips away the statistical flash of relative measures.
The table below breaks down these differences a bit more clearly.
Absolute vs. Relative Measures: A Comparison
This table clarifies why absolute measures like NNT are often superior for making real-world clinical decisions compared to relative measures, which can sometimes be misleading.
| Metric | What It Measures | Clinical Utility | Potential for Misinterpretation |
|---|---|---|---|
| NNT / ARR | The actual difference in event rates between groups. Answers: "How many people do I need to treat to prevent one bad outcome?" | High. Directly applicable to clinical practice and patient discussions. Helps weigh real-world benefits against costs and side effects. | Low. The number is intuitive. The main error is comparing NNTs from studies with different baseline risks or durations. |
| RRR | The proportional reduction in risk relative to the control group. Answers: "By what percentage did the treatment lower the event rate?" | Moderate. Useful for understanding the magnitude of an effect in a relative sense, but can be misleading without knowing the baseline risk. | High. A large RRR (e.g., 50%) can make a clinically insignificant effect seem huge if the baseline risk is very low. |
Understanding this distinction is key. Relative measures sound impressive, but absolute measures tell you what will actually happen in your clinic.
Finally, remember that NNT is usually calculated for a single, all-or-nothing outcome—the event either happened, or it didn't. It doesn't capture nuances like a patient's quality of life, the severity of their symptoms, or other important but non-fatal outcomes. Wise clinical practice means using NNT as one powerful tool in your belt, not as the final word on a treatment's value.
NNT Frequently Asked Questions (And Sticking Points)
Let's tackle some of the common questions and tricky concepts that trip students up when they're getting the hang of Number Needed to Treat.
What’s a “Good” NNT?
This is the million-dollar question, and the answer is always: it depends. There's no magic number that makes an NNT "good" or "bad." Context is everything.
Think about it this way: an NNT of 50 for a cheap, safe daily aspirin that prevents one heart attack sounds fantastic. But an NNT of 5 for a highly toxic, incredibly expensive chemotherapy that only prevents nausea? That’s probably a terrible trade-off.
A "good" NNT is always a balance. You have to weigh it against the severity of the outcome you're trying to prevent, the cost and safety of the intervention, and, most importantly, its evil twin: the Number Needed to Harm (NNH).
Can I Compare NNTs from Different Studies?
Comparing NNTs from two different studies is a classic trap—and almost always a bad idea. It's like comparing apples and oranges.
Why? Because an NNT is completely dependent on the study's specific conditions, especially the baseline risk of the patient population and the duration of the trial.
A treatment will always look better (i.e., have a lower NNT) in a high-risk group. For example, a statin will have a much more impressive NNT for preventing heart attacks in a group of 65-year-old smokers with diabetes than it will in a group of healthy 30-year-olds. Direct comparisons are only fair if the studies have nearly identical patient populations, interventions, and follow-up times.
Why Is NNT Better Than Relative Risk Reduction?
Here's a high-yield point for exams. Relative Risk Reduction (RRR) can sound incredibly impressive but be clinically misleading. It's a favorite tactic of drug reps for a reason.
Imagine a new drug reduces the risk of a rare side effect from 2 in 1,000 people to 1 in 1,000. The RRR is a whopping 50%! That sounds amazing on a slide.
But let's look at the NNT. The absolute risk reduction is just 0.1% (0.2% – 0.1%). That gives you an NNT of 1,000. You'd have to treat 1,000 people to prevent just one of these rare side effects. The NNT cuts through the marketing hype and gives you a grounded, real-world measure of the treatment's actual clinical impact.
