

The MCAT scale runs from 472 to 528, with a midpoint of 500. The mean was 500.6 for all exams administered from 2023 through 2025, while the 2024-2025 applicant mean was about 506 and the matriculant mean was about 512, so the overall average usually isn't a competitive target for many MD admissions decisions.
That difference is the key to understanding the MCAT average score. “Average” can refer to everyone who took the exam, people who applied to medical school, or students who ultimately matriculated at a U.S. MD-granting school. Those groups answer different questions, and confusing them can lead to an unrealistic score goal, an unnecessarily discouraging retake decision, or a school list that doesn't fit your academic profile.
The useful question isn't, “Is my score above 500?” It's, “How does my score fit my GPA trend, section profile, target schools, application timing, and overall evidence of readiness?” A lower score or difficult attempt deserves analysis, not shame. A strong score still needs context.
What the MCAT Average Score Really Means Today
The all-test-taker mean was 500.6 across 305,494 MCAT exams administered in 2023, 2024, and 2025, according to the AAMC's reported MCAT mean score. It sits near the scale midpoint, but it does not describe the typical medical school applicant.
Recent U.S. medical school applicants averaged 506.3 in 2023-2024 and 506.1 in 2024-2025. Students who matriculated at U.S. MD-granting schools averaged 511.7 and 511.8 in those cycles, respectively, according to the AAMC applicant and matriculant data.
Three averages, three different questions
| Group | Recent mean | What it helps you understand |
|---|---|---|
| All MCAT exams | 500.6 across 2023-2025 | The broader testing population |
| U.S. applicants | 506.3 in 2023-2024, 506.1 in 2024-2025 | The applicant pool |
| U.S. MD matriculants | 511.7 in 2023-2024, 511.8 in 2024-2025 | Students who enrolled after admissions |
These means describe different stages, much like measuring students in a classroom, the group submitting applications, and the group receiving seats. The applicant mean stayed close to 506, while its standard deviation increased from 10.0 to 10.1 across the two cycles. The typical applicant score changed little, but scores were slightly more spread out, as shown in the same AAMC data tables.
A matriculant mean is a description of an enrolled group, not an admissions cutoff. Schools also review prerequisites, grade trends, experiences, personal statements, recommendations, institutional mission, and other evidence of preparation. Your score should therefore be interpreted alongside your GPA pattern and the schools you may target.
Practical rule: Use the national average as a reference point, not as a promise of competitiveness.
How to use this guide
Start by identifying which comparison group fits your question. Then create a school-specific target by reviewing each program's MSAR data, score ranges, and GPA bands. A target worksheet can record the school, your GPA context, the relevant MCAT range, and a reasonable goal, so one national mean does not become an automatic cutoff.
Percentile rank can show how your score compares with examinees, but school research gives the more useful planning context. If your score is lower than hoped, complete a score audit. Separate content gaps, reasoning errors, pacing problems, and test-day factors before deciding whether additional preparation or a retake is appropriate.
How MCAT Scoring Works From Sections to Total
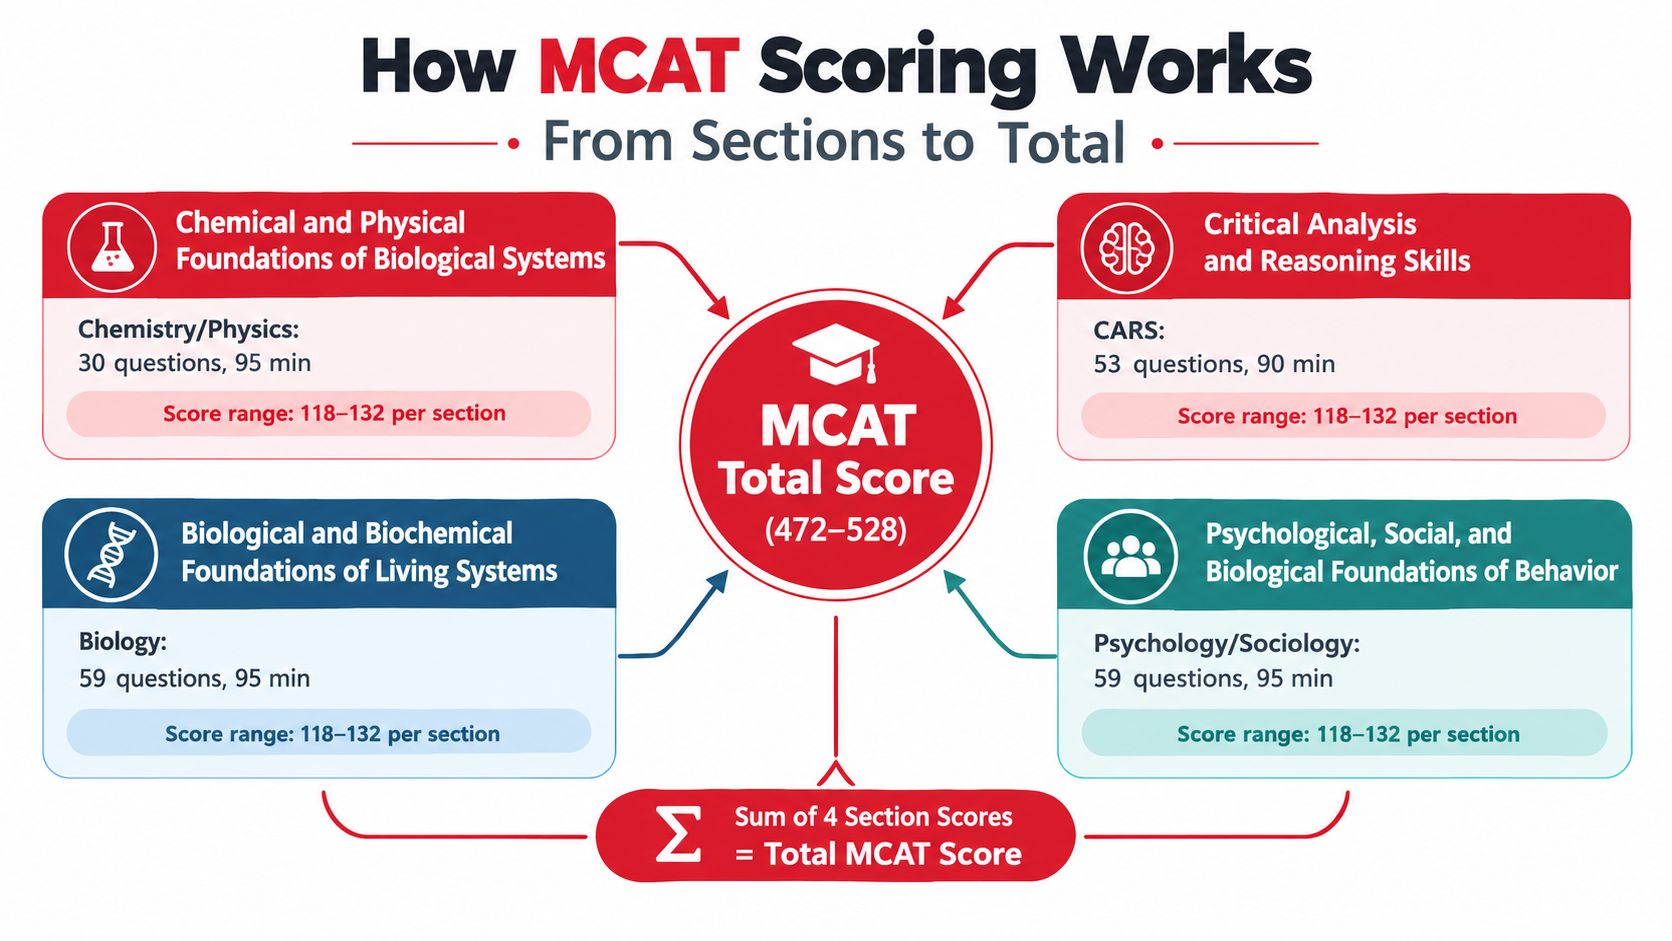
The MCAT has four scored sections, each measuring a different part of medical-school preparation:
- Chemical and Physical Foundations of Biological Systems, or CPBS, applies chemistry and physics to biological systems.
- Critical Analysis and Reasoning Skills, or CARS, assesses passage-based analysis and reasoning.
- Biological and Biochemical Foundations of Living Systems covers biology and biochemistry.
- Psychological, Social, and Biological Foundations of Behavior examines psychological and social science concepts in biological and behavioral settings.
Each section receives a scaled score from 118 to 132, with 125 as its midpoint. Adding the four section scores produces a total from 472 to 528, with 500 as the total midpoint. The AAMC MCAT score scale shows how these section and total scores relate.
Treat the total as four pillars
A total score is the sum of four section scores, so two students can reach the same total with very different profiles. One may perform steadily across all four sections. Another may post strong science scores while showing a clear gap in CARS or behavioral science.
That difference matters for preparation. A total score can summarize performance, but it cannot show whether the underlying issue is content knowledge, passage reasoning, calculations, or pacing. Review the section pattern before deciding that your overall score represents your readiness.
The scale also is not a raw percentage. A scaled score reflects the exam's scoring system, so do not convert it directly into a percentage correct without official context. Since unanswered questions do not create an advantage, practice pacing and educated guessing rather than leaving items blank.
Create a section-level baseline
Record your latest full-length results in a simple worksheet:
- List each section score separately.
- Mark the section that is repeatedly lowest, if one stands out.
- Classify the gap as a content problem, passage-interpretation error, calculation issue, careless reading, or time pressure.
- Choose broad review or targeted practice based on that diagnosis.
Use this profile when setting a school-specific target alongside MSAR score ranges and GPA bands. For a concise explanation of the scale and midpoint, review what the MCAT is scored out of. Your total gives the numerical summary. Your section scores explain the preparation work behind it.
National Average Versus Applicant and Matriculant Averages
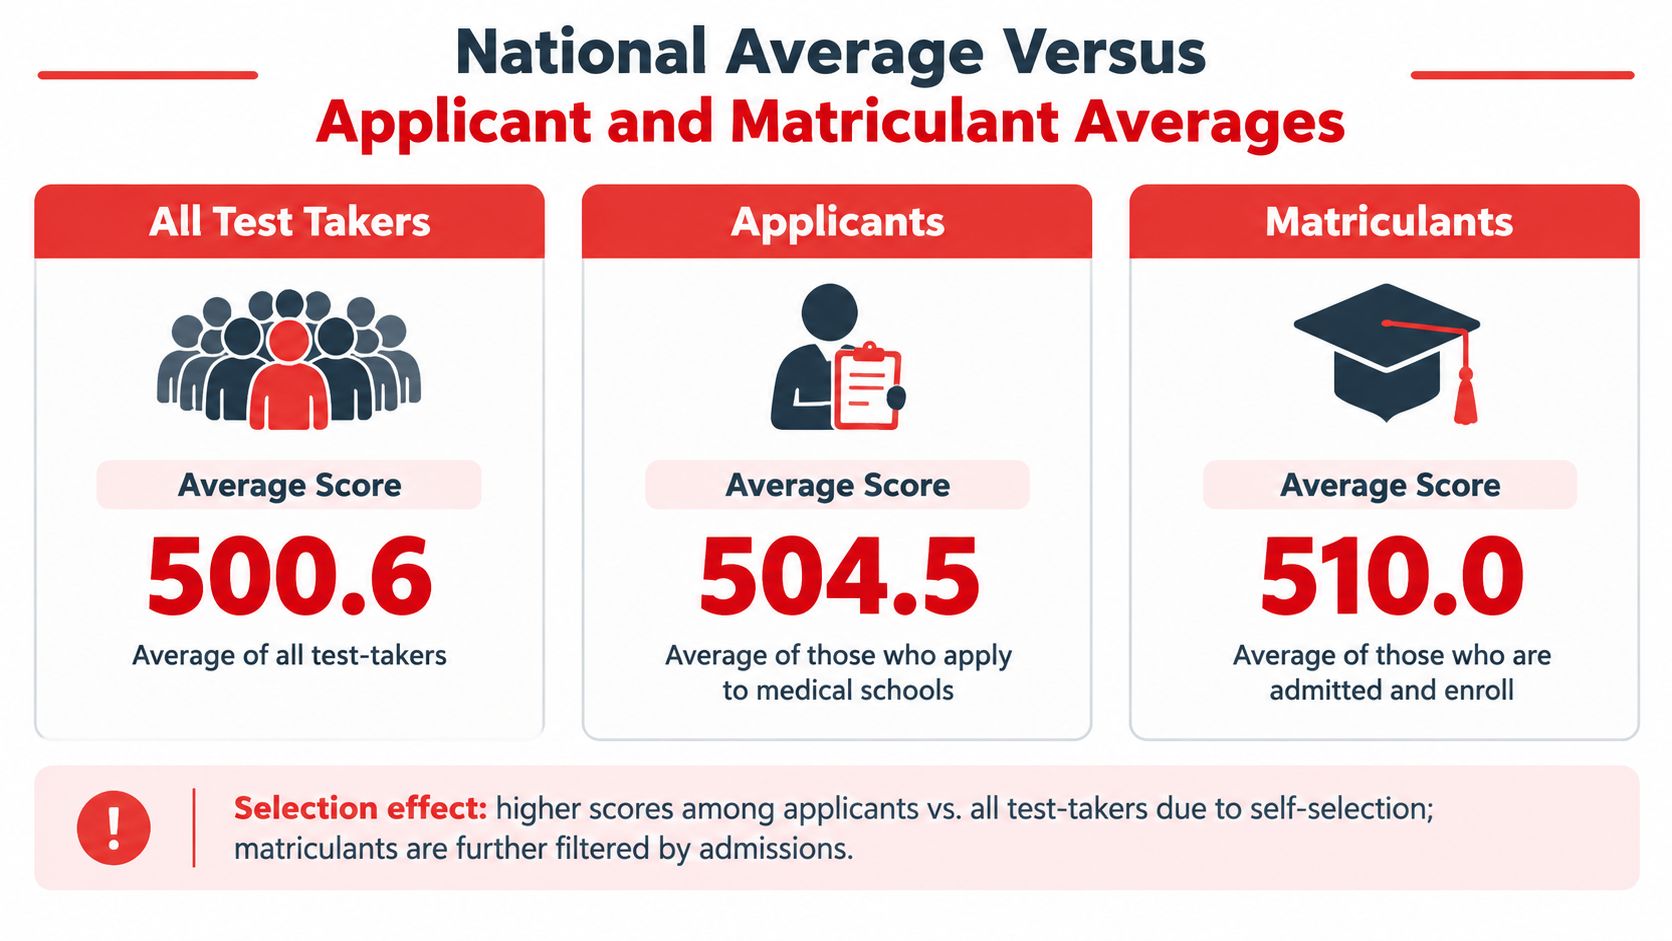
The national MCAT mean was 500.6, while applicants averaged 506.3 in 2023-2024 and 506.1 in 2024-2025. Matriculants averaged 511.7 and 511.8 in those cycles, respectively, according to AAMC applicant and matriculant reporting. These figures form a distribution, not a single target. The gap between groups reflects who each average represents.
Why the populations differ
People who take the MCAT do not all apply during the same cycle, apply to U.S. medical schools, or ultimately matriculate. All test takers are the broadest group. Applicants are a selected portion of that group, and matriculants are applicants who have progressed through an admissions process.
That progression helps explain the upward movement from the all-test-taker mean to the applicant mean and then the matriculant mean. It does not create a universal cutoff or convert the matriculant average into one applicant's admission probability.
The applicant means stayed close across the cited cycles. The practical lesson is that stage and population change the meaning of average. A score above the all-test-taker mean may still call for careful school-list planning.
Percentiles add relative context
A percentile rank shows the percentage of examinees who scored the same as or below a given score, according to the AAMC explanation of MCAT percentile ranks. It answers, “How did this score compare with other examinees?” It does not answer, “Will this score be accepted by a particular school?”
Percentiles depend on their reference group and reporting period. The current framework uses test takers from 2023-2025, so use the AAMC table connected to your score-reporting period rather than an older chart copied into a preparation article.
Use the following visual explanation for added context, then apply the comparison to your own school list.
An MCAT score range guide can help organize these comparisons. Pair the national distribution with each school's MSAR score ranges and GPA bands, then record a target range rather than treating one average as a verdict. This worksheet approach separates the broad testing mean from the applicant and matriculant benchmarks that better frame an application strategy.
What Counts as Competitive for MD DO and Different School Tiers
“Competitive” has no single national MCAT number. It depends on your school list, academic record, section pattern, experiences, mission fit, and application timing and quality. An average is a reference point, not a finish line.
For U.S. MD applicants, the recent national figures include an applicant mean of 506.3 for 2025-2026 and a matriculant mean of 512.1. The mean for all 305,494 exams administered from 2023 through 2025 was 500.6, according to AAMC applicant and matriculant materials. These means describe different groups. They cannot predict whether one school will accept one applicant.
The gap between groups matters. The all-test-taker mean describes exam performance broadly. The applicant mean reflects people who applied, while the matriculant mean reflects people who entered medical school. Use those values to understand the distribution, not to label your own score as adequate or inadequate.
DO applicants need the same individualized approach. Do not transfer one national MD figure directly to osteopathic schools, and do not treat a different score distribution as evidence that one pathway is less demanding. Compare each program's current information, mission, prerequisites, and applicant profile.
Use historical grids carefully
The AAMC FACTS tables A-16 and A-23 can help you examine historical relationships among GPA, MCAT bands, applicants, and acceptance outcomes. A historical acceptance percentage within a GPA and MCAT band is not an individual probability. Applicants in the same band may differ substantially in experiences, state ties, institutional mission, and application quality.
Use the grid as a planning worksheet:
| GPA Band | MCAT Band | Historical Acceptance Percentage | Target School Median | List Classification |
|---|---|---|---|---|
| Your GPA band | Your projected band | Record the dated FACTS value | Record each school's current MSAR value | Reach, target, or safer |
| Your GPA trend | Your official full-length range | Compare only within the same table period | Compare with the relevant school distribution | Reassess after review |
Complete the worksheet with current data. Compare your projected or official full-length range with each school's Medical School Admission Requirements, or MSAR, distribution and GPA bands. A reach can remain reasonable, but a balanced list should include target and safer options rather than only reaches.
A strong MCAT can strengthen academic evidence, but it cannot erase missing prerequisites, a concerning grade trend, limited experiences, or weak mission fit. A lower score does not end a medical career. It may call for more preparation, a revised testing timeline, a more carefully researched list, or advice about retesting.
For a practical explanation of context-specific score goals, read what makes a good MCAT score. Choose a target that fits your GPA band, supports a realistic school list, and matches the rest of your application.
Why Section Balance Matters More Than Total Alone
Two applicants can have the same total score but offer different evidence of preparation. A balanced profile may suggest steadier performance than a total supported by one pronounced weakness, especially when that weakness involves an academic area connected to the applicant's preparation. The total is a useful summary, but the four section scores show how that summary was built.
Recent AAMC data illustrate why section-level review matters. In 2025-2026, men averaged 508.4 and women averaged 504.8, a difference of 3.6 points. Women averaged 127.3 in CARS, compared with men's 127.8, while men averaged 127.2 in CPBS, compared with women's 125.8, according to the AAMC section and demographic score data.

Read the profile, not just the sum
Use your section pattern to identify the next measurable action:
- Is the lowest section consistent? A repeated low score calls for a root-cause review rather than a general increase in study time.
- Is the gap conceptual or procedural? Missing content requires targeted learning. Slow passage analysis or calculation requires a different intervention.
- Does performance hold under time pressure? Untimed accuracy can hide pacing problems that lower a full-length score.
- Can you explain missed distractors? Knowing the correct answer is incomplete if you cannot explain why the alternatives fail. That gap may indicate weak transfer to unfamiliar questions.
Demographic averages describe groups, not individual outcomes. The differences reported above should not be used to predict a student's result or assign a presumed profile. Your own official full-length history provides better planning evidence than an identity-based assumption.
Separate selection from inflation
All-test-taker means have stayed around 500.5 to 500.6, while applicant averages have remained around 506.1 to 506.5 across 2024-2026, as reported in the AAMC MCAT data report. The gap reflects differences between the broader testing population and the applicant pool. It does not mean every score has suddenly become outdated.
Review each section across recent official full-lengths. A single unusually high or low result may reflect test-day variation. A recurring weakness is a planning signal: identify its cause, choose a targeted intervention, and check whether later tests show improvement. Your target should reflect that distribution, alongside your GPA band and each school's MSAR profile, rather than treating the overall average as a required endpoint.
Build Your Target Score and Retrieval Based Study Plan
你的目標分數應該把招生研究轉成可執行的讀書行為。平均分數是分布中的參考點,不是所有人的終點。先用 GPA、學校資料和近期模考建立範圍,再用能檢查長期保留的提取系統安排學習。
分數目標工作表
使用有日期的資料填寫下表。把 all-test-taker mean、applicant mean 和 matriculant mean 分開記錄,因為它們代表申請流程中的不同群體。你的目標不必等於其中任何一個平均值,而應該符合自己的 GPA band、學校 MSAR 分布和 section-level gaps。
| 欄位 | 記錄內容 |
|---|---|
| GPA band | 目前累積 GPA 和 science GPA 所在範圍 |
| MCAT band | 近期官方 full-length 的分數範圍 |
| Historical acceptance percentage | 對應的 AAMC FACTS A-16 或 A-23 數值 |
| Target-school median | 每所學校目前 MSAR 的分布 |
| List classification | Reach、target 或 safer |
| Section balance | 最低分 section 和反覆出現的差距 |
| Application timing | 讀書進度是否配合預定申請週期 |
Percentile 表示你的分數在考生中的相對位置,AAMC 將其定義為分數低於或等於你的人所占比例。它不能取代學校層級的研究。將 recent official full-length range、GPA trend、目標學校的 MSAR 分布、section balance 和 application timing 放在一起判斷,會比把整體平均當成必須達到的門檻更有用。
Retrieval calendar
安排 retrieval practice、spacing、interleaving、feedback,以及對未見題目的 transfer。關於 retrieval practice、spacing 和 interleaving 的同儕審查研究支持 active recall 與分散複習,單靠重讀不足以確認記憶是否保留。你也可以先閱讀這份 active recall 的說明,再把概念轉成自己的題目。
| 日 | Study action | Evidence to record |
|---|---|---|
| 星期一 | 把筆記改寫成問題,不看資料直接提取 | Delayed recall |
| 星期二 | 複習星期一的錯題,混合一個相關主題 | Error tags |
| 星期三 | 完成計時的混合未見題 | Timed accuracy |
| 星期四 | 重做困難題,說明每個 distractor 為何不對 | Distractor explanations |
| 星期五 | 交錯練習各 section,複習訂正內容 | Recurring error patterns |
| 星期六 | 在時間限制下完成較長的混合題組 | Pacing and workload |
| 星期日 | 檢查本週表現,安排下一輪複習 | Completion and next steps |
一名標示為 composite learner 的學習者花四小時重讀,隔天卻無法提取事實。調整後的計畫把筆記改成問題,按逐漸拉長的間隔安排複習,混合相關主題,並在一週後用未見題檢查保留程度。這只是 composite example,不是 Ace Med Boards student case,也不承諾任何分數結果。
Error log and weekly adjustment
| Question task | Error type | Correction | Next review dates | Transfer test |
|---|---|---|---|---|
| Passage interpretation | 誤讀關係 | 用自己的話重寫關係 | 加入有日期的複習項目 | 解一篇未見 passage |
| Calculation setup | 選錯方程式 | 計算前先辨認變數 | 加入有日期的複習項目 | 完成新的 calculation |
| Content recall | 缺少概念 | 建立問題,閉卷回答 | 加入有日期的複習項目 | 在新情境解釋概念 |
| Distractor analysis | 接受部分正確的選項 | 說明每個 distractor 為何失敗 | 加入有日期的複習項目 | 口頭辯護最佳答案 |
Learning styles 標籤不能證明應把教學配合某種偏好的感官模式。選擇適合材料的呈現方式;只有在圖表能釐清結構時,才把文字和有用的圖表結合,而不是為了裝飾頁面。
每週記錄 delayed recall、timed accuracy、recurring error tags、completion,以及解釋 distractors 的能力。讀書時數本身無法顯示準備是否有效。當錯誤集中在某個 section 或題型時,調整介入方式,並在下一次混合未見題中確認是否改善。
Key Takeaways and Your Next Steps After the Average
An MCAT average is a reference point, not a universal finish line. Treat it like one marker on a distribution: first identify whether it represents all test takers, applicants, or matriculants, then compare your own total and section scores with the schools you may apply to.
Key takeaways
- Use the right comparison group: The all-test-taker mean describes broad exam performance. Applicant and matriculant means describe different stages of the admissions process, so they answer different questions.
- Read the distribution: A percentile rank shows how your score compares with other examinees. It does not predict admission by itself.
- Build a realistic list: Compare your MCAT band and GPA band with current MSAR information and dated AAMC admissions tables. A worksheet with one row per school can show where your academic profile fits.
- Audit section balance: A strong total can hide a recurring weakness. Record each section separately and identify errors that require focused repair.
- Measure retention: Delayed recall, timed accuracy, recurring error patterns, completion, and distractor explanations reveal preparation quality more clearly than study hours alone.
Readiness checklist
Before testing or retesting, confirm that recent official full-lengths consistently support your target range. Check whether the lowest section still shows the same error type, and include mixed, unseen questions in your plan. Review application timing so you have room to receive and use the score. If your results change, update the school list rather than treating the original list as fixed.
If you are deciding when preparation should begin, use this MCAT study timeline guide to coordinate the test date with coursework and application plans. A low score, a failed attempt, or an academic gap calls for a specific review plan, not a judgment about your ability to become a physician.
Support for your next review
Ace Med Boards offers MCAT preparation and admissions-focused guidance for reviewing a score profile, organizing an error log, and connecting study decisions with a realistic school list. Visit Ace Med Boards to review available support and request a free consultation or Board Score Audit.