

A 510 MCAT score corresponds to the 79th percentile and is generally considered competitive for most MD programs, while 515 or higher aligns with roughly the top 10% of test takers. The right definition of “good,” however, depends on your GPA, school list, section profile, and application timing.
Introduction
The MCAT's 472 to 528 scale can make a single number feel definitive, but admissions decisions don't use that number in isolation. A 510 places you ahead of roughly four out of five test takers, while a 515 represents a substantially stronger national position. Neither score guarantees admission, and a lower score doesn't end a medical career.
This guide is for pre-medical applicants, osteopathic applicants, international students, and other future medical students deciding how to interpret an MCAT result or set a realistic target. It uses the AAMC percentile table in effect from May 1, 2026, through April 30, 2027, together with the official AAMC score-report example and percentile definition.
The analysis moves from scoring mechanics to percentile interpretation, then to school-list strategy and GPA context. It also provides a score-target worksheet, a readiness checklist, and a practical review process for deciding whether your current performance supports your application plan.
Understanding MCAT Scoring Mechanics
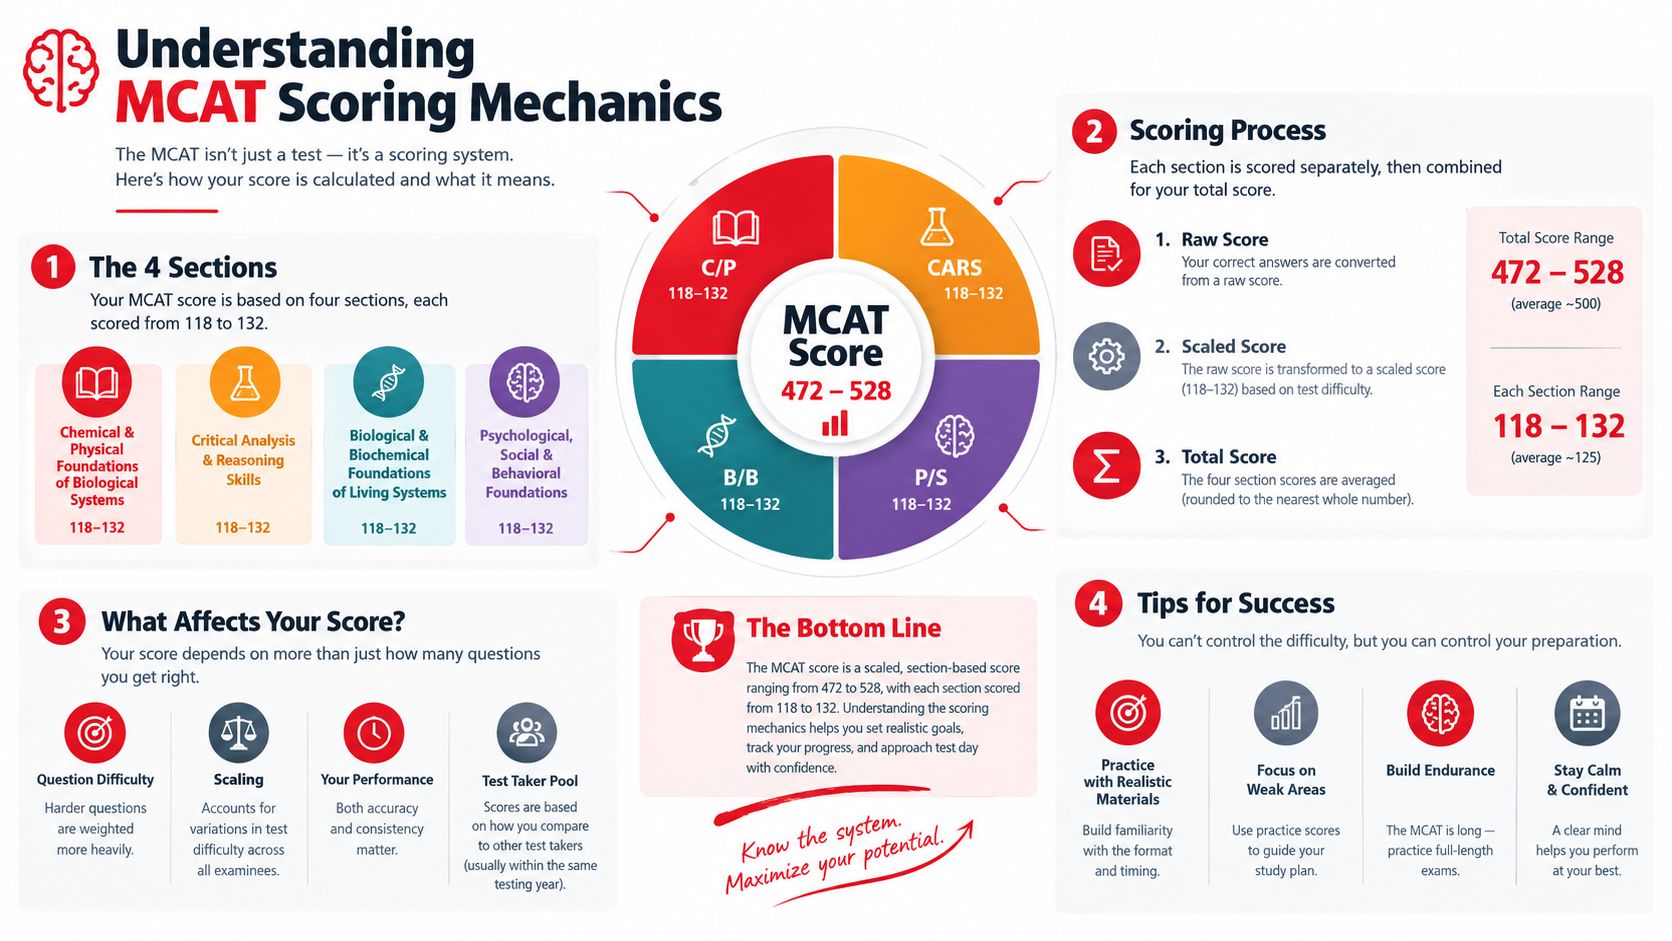
The MCAT produces five linked measures: four section scores and one total score. Its sections are:
- Chemical and Physical Foundations of Biological Systems
- Critical Analysis and Reasoning Skills, or CARS
- Biological and Biochemical Foundations of Living Systems
- Psychological, Social, and Biological Foundations of Behavior
Each section is scaled from 118 to 132. Adding the four section scores produces a total from 472 to 528. The official report therefore shows both overall performance and the distribution of strengths across sections. This overview of what the MCAT is scored out of explains the scale in more detail.
A scaled score is not the same as a percentage correct. The AAMC adjusts results for differences in question difficulty across exam forms, so an identical number of correct answers can lead to different scaled results on different forms. Applicants should therefore avoid converting a total score into an estimated raw percentage or using that estimate to set an admissions target.
Practical rule: Use the official scaled score and percentile when judging readiness or application competitiveness.
Percentile rank measures the percentage of scores equal to or below a given score point. It answers a relative question, where your result stands among test takers. The scaled score answers a different question, where your result falls on the MCAT's fixed scoring scale. Admissions analysis needs both measures, especially when comparing a score with current percentile data and the expectations of specific schools.
Section-level results can change the interpretation of a total. In the AAMC score-report example, a total score of 501 corresponds to the 49th percentile, while section scores of 124, 123, 127, and 127 correspond to 43%, 35%, 72%, and 64%, respectively. A composite score can therefore hide a substantial CARS weakness or a clear science strength. Review the four sections before deciding whether a retake or a particular school list is warranted.
Interpreting Percentiles for a Good Score
A raw total becomes more useful when you translate it into national standing. The current AAMC percentile table, dated May 1, 2026, through April 30, 2027, provides the clearest benchmark for answering what is a good score on the MCAT.
| MCAT total score | AAMC percentile | Practical interpretation |
|---|---|---|
| 500 | 48th percentile | Near the middle of the distribution |
| 510 | 79th percentile | Ahead of roughly four out of five test takers |
| 511 | 82nd percentile | Upper-percentile performance |
| 515 | 91st percentile | Roughly top 10% nationally |
| 520 | 97th percentile | Roughly top 3% nationally |
These figures come from the AAMC percentile-rank table for the MCAT. The table shows that 500 is the 48th percentile, which is close to the middle of the distribution rather than distinctly competitive for every selective application. By contrast, 510 is the 79th percentile, and 515 is the 91st percentile.
The difference between adjacent scores can matter because the MCAT distribution is compressed in some regions. A few points may move an applicant through several percentile bands, especially around commonly targeted scores. That doesn't mean every point has equal admissions value at every school. It means applicants should evaluate score movement through both lenses, the numerical change and the percentile change.

Why percentile is more informative than a universal cutoff
A universal cutoff fails because schools enroll different applicant populations and use different selection priorities. A 510 may be a strong foundation for one applicant's balanced school list, while another applicant targeting schools whose current admitted-student distribution centers higher may need a different target.
The useful question isn't “Is my score good in the abstract?” It's “Does my score support the schools I'm applying to, given the rest of my record?” A score-target analysis should therefore begin with your school list, not with an arbitrary national label. You can use this MCAT score-range guide as a starting point, then verify each school's current data directly.
Aligning Scores with Application Goals
MCAT interpretation changes with the type of application you're building. A student applying broadly to MD programs has a different decision problem from an applicant focused on osteopathic programs, state-specific schools, or institutions with a particular mission. The score itself doesn't change, but its strategic meaning does.
The AAMC percentile data supports a practical set of broad reference points:
- Around 500: This sits near the national middle and may require especially careful school-list construction and attention to the rest of the application.
- Low 510s: This represents upper-percentile performance and can support a competitive MD application when paired with appropriate schools and strong non-MCAT evidence.
- 515 or higher: This places the score around the top 10% nationally, but it still isn't an admissions promise or a substitute for prerequisites, experiences, recommendations, essays, and mission fit.
- 520: This is in the 97th percentile, a very strong national result that still needs to be interpreted in the context of each school's current applicant pool.
A school's MSAR distribution is more useful than a generic category such as “top-tier” or “average.” Review the median and spread for total and section scores, then consider whether your score falls below, near, or above the center of that distribution. Publicly available admissions information can help with initial research, but applicants should verify current school-specific details through official sources.
Applying the same logic across MD and DO goals
MD and DO applications should remain distinct in your analysis. Don't transfer an assumed MD target directly to every osteopathic school, and don't treat a DO application as a fallback category without researching each program's mission, prerequisites, and applicant profile.
International applicants and foreign medical graduates also need a separate framework from U.S. pre-medical applicants. The MCAT is relevant to medical-school admissions when a school requires it, but it isn't a substitute for reviewing each institution's eligibility rules. Requirements for prior coursework, transcripts, language proficiency, and immigration status can vary, so consult the school directly.
For a structured review of academic metrics, use the medical-school GPA and MCAT requirements guide, then build a school list that includes realistic options rather than relying on one score label.
Combining GPA and MCAT with Acceptance Data
A 3.5 GPA doesn't map to one nationally recommended MCAT cutoff. The relevant question is how your GPA band and MCAT range appear together in the AAMC's historical acceptance data, and how that combination compares with the current distribution at your target schools.
The AAMC FACTS tables should be read carefully. A historical acceptance percentage describes applicants within a particular GPA and MCAT grouping during the reported application period. It is not an individual probability, and it doesn't account for state residency, experiences, institutional mission, academic trend, prerequisites, or application quality.
The requested grid should therefore be used as a worksheet rather than as a promise:
| GPA band | MCAT range | Acceptance rate | School median | Applicant category |
|---|---|---|---|---|
| 3.0 to 3.49 | 500 to 504 | Enter the current AAMC FACTS A-23 figure | Enter each school's current MSAR median | Reach, target, or safer based on school data |
| 3.0 to 3.49 | 505 to 509 | Enter the current AAMC FACTS A-23 figure | Enter each school's current MSAR median | Reach, target, or safer based on school data |
| 3.0 to 3.49 | 510 to 514 | Enter the current AAMC FACTS A-23 figure | Enter each school's current MSAR median | Reach, target, or safer based on school data |
| 3.0 to 3.49 | 515+ | Enter the current AAMC FACTS A-23 figure | Enter each school's current MSAR median | Reach, target, or safer based on school data |
| 3.5 to 3.89 | 500 to 504 | Enter the current AAMC FACTS A-23 figure | Enter each school's current MSAR median | Reach, target, or safer based on school data |
| 3.5 to 3.89 | 505 to 509 | Enter the current AAMC FACTS A-23 figure | Enter each school's current MSAR median | Reach, target, or safer based on school data |
| 3.5 to 3.89 | 510 to 514 | Enter the current AAMC FACTS A-23 figure | Enter each school's current MSAR median | Reach, target, or safer based on school data |
| 3.5 to 3.89 | 515+ | Enter the current AAMC FACTS A-23 figure | Enter each school's current MSAR median | Reach, target, or safer based on school data |
| 3.9+ | 500 to 504 | Enter the current AAMC FACTS A-23 figure | Enter each school's current MSAR median | Reach, target, or safer based on school data |
| 3.9+ | 505 to 509 | Enter the current AAMC FACTS A-23 figure | Enter each school's current MSAR median | Reach, target, or safer based on school data |
| 3.9+ | 510 to 514 | Enter the current AAMC FACTS A-23 figure | Enter each school's current MSAR median | Reach, target, or safer based on school data |
| 3.9+ | 515+ | Enter the current AAMC FACTS A-23 figure | Enter each school's current MSAR median | Reach, target, or safer based on school data |
Use the official AAMC FACTS data and table resources to retrieve the current A-23 grid before completing the worksheet. Pair it with each school's current MSAR information instead of copying figures from an older advising article.
What a stronger MCAT can and cannot do
A stronger MCAT can provide additional academic evidence, especially when your GPA trend, science preparation, or institutional context needs fuller interpretation. It cannot erase missing prerequisites, a concerning academic trend, limited clinical exposure, weak essays, absent recommendations, or poor mission fit.
For another perspective on interpreting score benchmarks, review average MCAT score context, but keep the central distinction clear: an average is descriptive, not a required threshold.
How to Set a Personalized MCAT Target
A personalized target should combine your demonstrated performance with the schools you may realistically attend. Use this worksheet before you register, reschedule, or decide whether a retake is justified.
The five-part target worksheet
Record recent official full-length results. List each AAMC full-length score, section breakdown, test date, and testing conditions. Look for a stable range rather than selecting the highest isolated result.
Compare your range with target-school data. For each school, record the current MSAR median and relevant section distributions. Mark your position as below, near, or above the reported center.
Add GPA and trend. Record cumulative GPA, science GPA if available in your application data, post-baccalaureate or graduate coursework, and whether recent academic performance is rising, flat, or declining.
Audit section balance. A total score can hide a meaningful discrepancy. Compare each section with the school information you've collected and identify whether one weakness reflects content gaps, passage reasoning, timing, or test anxiety.
Account for application timing. A higher target may be useful, but delaying an application also has strategic consequences. Choose a test date that leaves time to receive the score, reassess the school list, and submit a complete application.

Write your decision in one sentence: “My target is ___ because my recent official range is ___, my target-school medians are ___, my GPA trend is ___, and my application timing allows ___.” If you can't complete that sentence with evidence, your target is still a wish rather than a plan.
This video can supplement your planning process, but it shouldn't replace current AAMC materials or school-specific information.
A simple decision tree
- Your recent official scores are below your school-list range: Continue preparation and reassess before testing.
- Your scores overlap the range but fluctuate widely: Diagnose consistency, timing, and test-day conditions before setting a final date.
- Your scores consistently support the list: Focus on maintaining performance and completing the broader application.
- Your score exceeds the list but one section is substantially weaker: Review school-specific section expectations before deciding whether further testing adds value.
Actionable Steps to Improve or Interpret Your Score
Start with a score audit, not a new study schedule. For each section, classify missed questions into content knowledge, passage interpretation, reasoning, timing, careless error, or uncertainty. Then count patterns qualitatively. Repeated misses in one topic require a different response from scattered errors caused by fatigue or rushed reading.
A useful review workflow looks like this:
- Reconstruct why you chose the original answer.
- Explain why the correct answer fits the passage or concept.
- Identify the precise rule, fact, or reasoning step you missed.
- Write one short correction in your own words.
- Revisit the correction later without rereading the full explanation.
Use official AAMC materials for calibration, especially when interpreting full-length performance. Avoid treating third-party questions as interchangeable with official practice. A tutor or coach can help identify recurring reasoning errors, but independent review remains necessary.
A flexible weekly template
| Study block | Primary task | Review output |
|---|---|---|
| Early week | Content repair in the weakest area | Short error log |
| Midweek | Timed passage and question practice | Reasoning notes |
| Later week | Mixed-section practice | Timing and fatigue observations |
| Weekend | Full-length or substantial timed block | Section-by-section audit |
| Following day | Review rather than new testing | Revised study priorities |
Keep a dated record of practice scores and section performance. The purpose isn't to chase every fluctuation. It's to determine whether your preparation is producing a stable range that supports your application plan.
For individualized preparation support, MCAT score improvement guidance can help you organize the review process. Ace Med Boards offers one-on-one MCAT preparation and admissions support, but any tutoring should complement, not replace, official AAMC practice materials and your own independent work.
Conclusion and Key Takeaways
A “good” MCAT score depends on your GPA, school list, and application strategy. The current AAMC percentile table offers useful reference points: 500 is the 48th percentile, 510 is the 79th percentile, 515 is the 91st percentile, and 520 is the 97th percentile for the table effective May 1, 2026, through April 30, 2027. See the AAMC MCAT percentile ranks and the AAMC percentile-rank definition for the underlying interpretation.
Use those figures as calibration, not as universal cutoffs. A 3.5 GPA, for example, should not produce one automatic MCAT target. The AAMC FACTS acceptance grid can help you compare GPA and MCAT combinations across applicant groups, while your intended school tiers determine how competitive your target needs to be.
Your practical target should also match a stable range on recent official full-length exams. One unusually high practice score is weaker evidence than repeated performance near the same level. The AAMC official score-report example also illustrates how scores and section results are presented.
The MCAT strengthens academic evidence, but it does not replace prerequisites, experiences, essays, recommendations, or mission fit. Review your score alongside GPA, section balance, school tiers, and timeline before deciding whether to test again.
Sources
- AAMC FACTS data resources
Ace Med Boards can help review practice performance, identify section priorities, and connect a score target with an admissions plan. Visit Ace Med Boards to learn about MCAT preparation and request a free consultation or Board Score Audit.