
When you run a test and it comes back negative, what's the first question that pops into your head? Probably something like, "Okay, but how sure can I be that my patient really doesn't have this disease?"
That's exactly what Negative Predictive Value (NPV) tells you. Think of it as your reassurance score. A high NPV means you can confidently tell your patient that their negative result is a reliable all-clear.
Understanding Your Reassurance Score
In the clinic, we're not just crunching numbers; we're answering a very human question: "Doctor, the test was negative. Does that mean I'm okay?" A high NPV lets you answer that with a confident "yes."
Imagine a highly trained airport security dog screening for contraband. If the dog sniffs a bag and doesn't bark, the NPV is the probability that the bag is genuinely clean. A great dog (a test with high NPV) almost never misses, so you can trust its silence. That level of confidence is exactly what we need when ruling out serious conditions.
Once you get that, the formula makes perfect sense. It’s simply the proportion of true negatives out of all the negative results the test produced.
Negative Predictive Value Formula:
NPV = True Negatives / (True Negatives + False Negatives)
Notice how the formula only looks at the patients who tested negative. It isolates that group to tell you how much you can trust that negative result. For example, a study on pediatric pneumonia showed that chest X-rays had an impressive NPV of 99.7%. For pediatricians, that provides powerful assurance that a negative X-ray reliably rules out the diagnosis.
Key Diagnostic Test Metrics at a Glance
To really nail down NPV for your board exams, you have to see how it fits in with its statistical siblings. Each metric answers a slightly different clinical question, and the USMLE loves to test your ability to tell them apart.
For example, a common internal medicine question might involve using the ankle-brachial index (ABI) to screen for polyvascular disease. Here, NPV is your go-to for figuring out what percentage of patients with a negative ABI are truly free of the disease. A 2017 study highlighted the ABI's specificity at 92.4% but, in a common pitfall you'll see in medical literature, didn't report its NPV.
This high-yield table will help you keep these crucial terms straight.
| Metric | What It Measures | Mnemonic (For Exam Recall) | Best Used For |
|---|---|---|---|
| Negative Predictive Value (NPV) | The probability of being disease-free with a negative test. | Think "N" for Negative and No disease. | Ruling out a disease, especially when pre-test probability is low. |
| Positive Predictive Value (PPV) | The probability of having a disease with a positive test. | Think "P" for Positive and Presence of disease. | Confirming a diagnosis, especially in high-risk populations. |
| Sensitivity | The test's ability to correctly identify those with the disease. | SN–N–OUT: A highly Sensitive test, when Negative, rules it OUT. | Screening for a disease; you don't want to miss any true cases. |
| Specificity | The test's ability to correctly identify those without the disease. | SP–P–IN: A highly Specific test, when Positive, rules it IN. | Confirming a diagnosis; you want to avoid false positives. |
Mastering these distinctions is non-negotiable for exam day. It's also helpful to see how these metrics connect to other clinical calculations. If you're looking for more, check out our guide on the number needed to treat.
Mastering the 2×2 Table for NPV Calculations
If you want to truly get a handle on Negative Predictive Value, you need to master its home turf: the 2×2 contingency table. For biostatistics on your board exams, this simple grid is your single most important tool. It’s what transforms abstract concepts into a logical, visual framework, turning otherwise complex questions into straightforward calculations.
Think of the 2×2 table as a filing cabinet for your patient data. It neatly sorts every single person into one of four buckets based on two key pieces of information: whether they actually have the disease and what their test result showed.
Setting Up Your Framework for Success
Properly labeling your table is the first—and most critical—step to avoiding confusion. The columns always represent the Disease Status (the gold standard truth), while the rows represent the Test Result.
- Columns: Disease Present vs. Disease Absent
- Rows: Test Positive vs. Test Negative
This setup creates four distinct cells, and understanding what each one means is the foundation for calculating not just NPV, but all the key diagnostic metrics. You can learn more about how these concepts connect in our complete guide on sensitivity and specificity.
Let’s quickly define what each cell represents:
- True Positive (TP): The patient has the disease, and the test correctly caught it. A win.
- False Positive (FP): The patient does not have the disease, but the test incorrectly flagged them. This causes unnecessary anxiety.
- False Negative (FN): The patient has the disease, but the test missed it. This is often the most dangerous clinical error.
- True Negative (TN): The patient does not have the disease, and the test correctly cleared them. The ideal outcome for a healthy patient.
When we're talking about Negative Predictive Value, our entire focus shifts to the bottom row of this table—the world of patients who received a negative test result.
Locating NPV on the Table
Zoom in on that bottom row. It contains two groups: those who truly don't have the disease (True Negatives) and those who tragically do but were missed by the test (False Negatives). Add them together (TN + FN), and you have every single person who walked out of the clinic with a negative result.
This is where the formula for NPV comes directly from the table's structure. It’s not just something to memorize; it’s a story the table tells you.
NPV = True Negatives / (True Negatives + False Negatives)
You're simply asking: Of all the people who tested negative, what percentage were actually disease-free? It’s a direct measure of how trustworthy that "negative" result really is.
This concept map breaks it down visually.
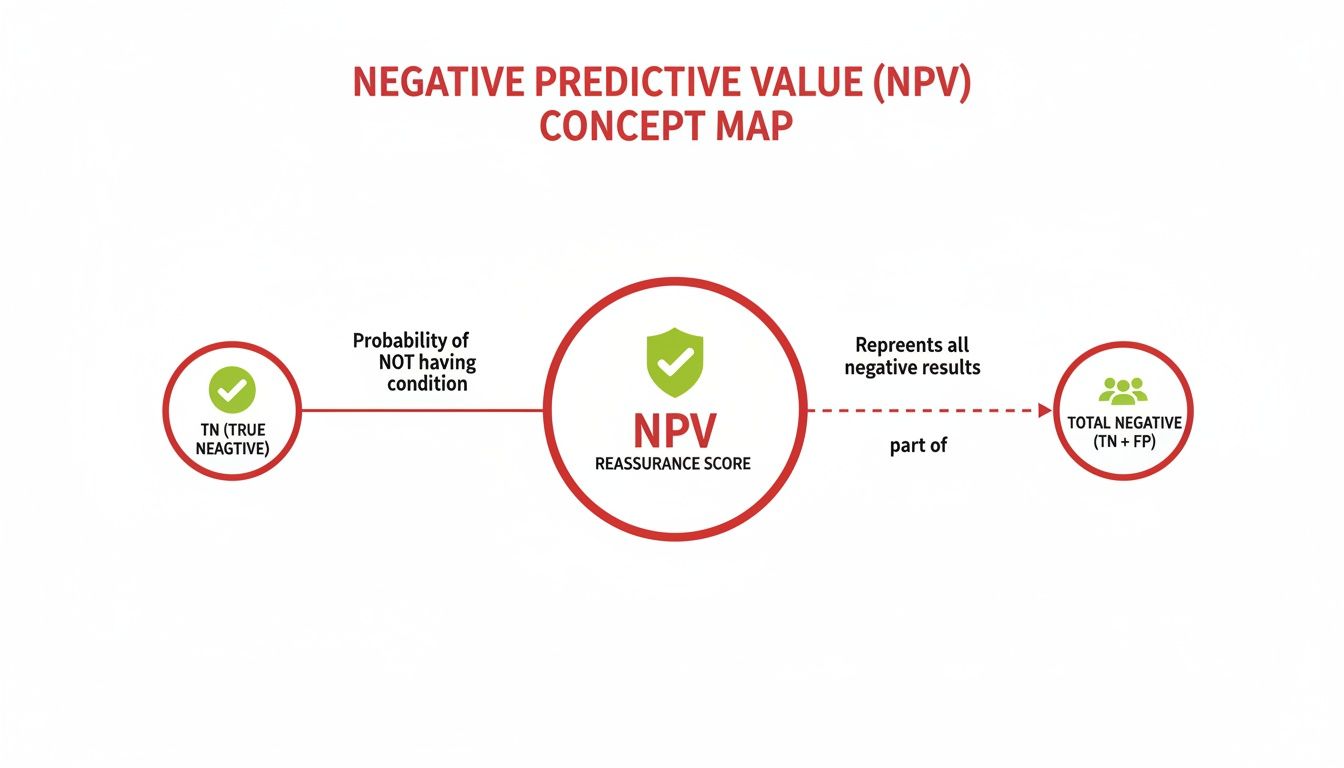
As you can see, the "reassurance score" of NPV comes from comparing the correctly identified negatives (TN) to the entire group of people who were told they were negative.
Once you can confidently fill out a 2×2 table, you stop needing to memorize formulas. You can see where the numbers come from and what they mean. This moves you from rote memorization to true comprehension—ensuring you can solve any related question thrown your way on exam day. The table becomes your roadmap, not another problem to solve.
Calculating NPV with Step-by-Step Clinical Examples

Knowing the definition of negative predictive value is great, but board exams couldn't care less about definitions. They want to see if you can apply the concept, under pressure, and get the right answer. Fast.
This is where the rubber meets the road. We’re going to walk through the calculations step-by-step, starting with a simple numerical example to build your muscle memory. Then, we'll dive into a realistic clinical vignette you might see on exam day.
Let’s get the reps in so this becomes second nature.
Example 1: Building Your Foundation with a Simple Cohort
Let's start with a hypothetical group of 1,000 patients. Using a big, round number like this makes the math feel intuitive and helps lock in the process before we add the complexity of a real clinical scenario.
Here are the stats for our first run-through:
- Total Patients: 1,000
- Disease Prevalence: 20%
- Test Sensitivity: 90%
- Test Specificity: 80%
Our first job is to use these numbers to build our 2×2 table from scratch.
Step 1: Calculate the Disease and No Disease Groups
First things first, we need to figure out how many people actually have the disease. With a prevalence of 20%, the math is straightforward.
- Disease Present: 1,000 patients x 0.20 = 200 patients
- Disease Absent: 1,000 patients – 200 patients = 800 patients
Boom. Those are the totals for our two columns in the 2×2 table.
Step 2: Fill in the Cells Using Sensitivity and Specificity
Now, let's look at the 200 patients who actually have the disease. We’ll use sensitivity to find out how many tested positive (True Positives) and how many were missed (False Negatives).
- True Positives (TP): 200 x 0.90 (Sensitivity) = 180
- False Negatives (FN): 200 – 180 = 20
Next, we turn to the 800 patients who do not have the disease. We'll use specificity to find the True Negatives and the False Positives.
- True Negatives (TN): 800 x 0.80 (Specificity) = 640
- False Positives (FP): 800 – 640 = 160
Step 3: Calculate the Negative Predictive Value
With our table fully populated, we can zero in on the bottom row—everyone who got a negative test result (the FNs and TNs).
- Total Negative Tests: 20 (FN) + 640 (TN) = 660
Now we can plug these numbers right into the NPV formula:
NPV = TN / (FN + TN) = 640 / 660 ≈ 97%
So, what does this mean? If a patient from this population gets a negative test, there's a 97% chance they are truly free of the disease. This is the kind of confidence a good screening test provides. For anyone who struggles to build these formulas on the fly, some modern tools like AI formula generators can help visualize the structure.
Example 2: Applying NPV to a Clinical Vignette
Alright, let's try a board-style question. A 68-year-old male comes into the ED complaining of shortness of breath. You're thinking about congestive heart failure (CHF) and decide to order a B-type natriuretic peptide (BNP) test. You know that in your hospital's population, the prevalence of CHF is about 10%. The BNP test you use has a sensitivity of 71% and a specificity of 98%.
What is the negative predictive value of this test?
Step 1: Populate the 2×2 Table
Just like before, let's assume a cohort of 1,000 patients to keep the numbers clean.
- Disease Present (CHF): 1,000 x 0.10 = 100 patients
- Disease Absent (No CHF): 1,000 – 100 = 900 patients
Step 2: Calculate TP, FN, TN, and FP
Now, run the numbers for each box in our table.
- TP: 100 (CHF patients) x 0.71 (Sensitivity) = 71
- FN: 100 – 71 = 29
- TN: 900 (No CHF) x 0.98 (Specificity) = 882
- FP: 900 – 882 = 18
Step 3: Calculate the Final NPV
We're interested in the patients who tested negative, so we'll use our TN and FN values.
- Total Negative Tests: 29 (FN) + 882 (TN) = 911
- NPV: 882 / 911 ≈ 96.8%
This calculation tells you that when a patient's BNP test comes back negative, you can be about 97% confident that they do not have CHF. This is a powerful tool for ruling out a diagnosis. Having this process down cold is as fundamental as knowing how to interpret chest x-rays with precision.
How Disease Prevalence Transforms Your Test Results
Here’s a concept that absolutely separates the top-scoring students from everyone else on board exams: understanding that predictive values aren't static. While a test's sensitivity and specificity are fixed traits—like a person's height—its Negative Predictive Value (NPV) is completely fluid. It changes dramatically based on one crucial factor: the prevalence of the disease in the population you're testing.
This isn't just some academic footnote; it's the bedrock of sharp clinical judgment. The very same test can be a powerhouse diagnostic tool in one setting and almost useless in another. Getting this right is critical for interpreting results correctly, and it’s a favorite topic for those tricky USMLE questions designed to test your deeper understanding.
Low Prevalence Scenarios: A Test's Best Friend
Let’s go back to our B-type natriuretic peptide (BNP) test for congestive heart failure (CHF). First, imagine you're in a general primary care clinic, screening a low-risk patient. In this setting, the prevalence of actual CHF is incredibly low—let's say it's just 2%.
When a disease is rare, the vast majority of your patients are going to be true negatives. The pool of healthy people is just massive compared to the tiny handful who actually have the disease. Because of this, even if the test spits out a few false negatives, they become a tiny drop in a huge ocean of true negatives. This is what drives the NPV sky-high, often climbing above 99%.
In a low-prevalence setting, a negative test result is incredibly reassuring. This is the statistical engine that powers effective screening programs, where the whole point is to confidently rule out a disease in a large, mostly healthy population.
Mastering this principle is a huge step in building your clinical reasoning skills. When prevalence is low, a negative test gives you a powerful "all-clear" signal.
High Prevalence Scenarios: A Totally Different Story
Now, let's switch gears. You’re no longer in a primary care clinic. You’re on rotation in a specialized inpatient heart failure unit. Every patient here was referred because they are highly suspected of having CHF. The disease prevalence in this group might be a whopping 75%.
What happens to our trusty BNP test's NPV now?
In this environment, the number of people who truly have the disease is enormous. This dramatically increases the absolute number of false negatives the test will produce, even though its sensitivity hasn't changed a bit. Suddenly, those false negatives are no longer a tiny drop in the bucket—they make up a much bigger slice of all the negative results.
As a result, the NPV plummets. A negative test in this high-prevalence setting is far less comforting. You can no longer be confident that a negative result truly means the patient is disease-free.
Impact of Prevalence on Predictive Values
The relationship between prevalence, NPV, and Positive Predictive Value (PPV) is predictable, powerful, and something you absolutely need to have locked down for your exams. The table below shows just how critical this dynamic is, using a hypothetical test where sensitivity and specificity stay the same.
| Prevalence | Negative Predictive Value (NPV) | Positive Predictive Value (PPV) | Clinical Implication |
|---|---|---|---|
| Low (e.g., 2%) | Very High (e.g., 99%) | Low (e.g., 15%) | Excellent for ruling out disease. A negative result is very trustworthy, but a positive one needs confirmation. |
| Moderate (e.g., 20%) | High (e.g., 94%) | Moderate (e.g., 55%) | Still a useful rule-out test, but a positive result carries more weight than in the low-prevalence group. |
| High (e.g., 75%) | Low (e.g., 40%) | Very High (e.g., 95%) | Poor for ruling out disease. A positive result is very likely a true positive, but a negative one is not very reliable. |
This concept has direct, real-world consequences. A high NPV is your best friend when you need to rule something out with confidence. For example, one analysis of the BNP test for CHF showed that at a 13% prevalence, the NPV was a solid 90%. But when that prevalence was slashed to just 2%, the NPV jumped to an incredible 99%. That’s the power of context.
At the end of the day, understanding how prevalence shapes your test results isn't just about passing an exam. It’s about becoming a clinician who can look beyond the numbers on a lab report and wisely interpret data in the context of the individual patient sitting right in front of you.
High-Yield Mnemonics and Common Exam Pitfalls

Knowing the formula for negative predictive value is just the start. If you want to crush your board exams, you need to think like the test makers—sidestepping their traps and using quick-recall aids to lock in the concepts under pressure.
When it comes to ruling a disease out, your best friend is the classic mnemonic SNOUT.
SNOUT: A highly Sensitive test, when Negative, helps rule OUT the disease.
Why does this work so well? A highly sensitive test is a master at catching true positives, which means it rarely misses the disease. In other words, it produces very few false negatives. When you have a tiny number of false negatives (FN) in the NPV formula—TN / (TN + FN)—that denominator gets smaller, pushing the NPV closer to a reassuring 100%. This is what gives you the confidence to tell a patient their negative result means they likely don't have the disease.
Navigating Common Board Exam Traps
Memorizing SNOUT is half the battle. The other half is recognizing how exam questions will try to trip you up. They love to blur the lines between similar-sounding stats.
Here are the most common pitfalls to watch out for:
- Confusing NPV with Specificity: This is a classic. Specificity is the True Negative Rate—a fixed characteristic of the test itself. It tells you how well the test identifies healthy people. But NPV answers the clinical question: "Given this negative result, what's the probability my patient is actually disease-free?" Don't mix them up; NPV changes with prevalence, while specificity doesn't.
- Forgetting Prevalence is King: This is the #1 mistake students make. You simply cannot calculate NPV without knowing the disease prevalence. A question might give you flawless sensitivity and specificity data, but if it doesn't mention prevalence, the answer is "cannot be determined." It's a classic trick.
- Misapplying the Clinical Context: A test's NPV in a low-prevalence primary care setting is completely different from its NPV in a high-prevalence specialty clinic. Always read the question stem carefully. Is this a screening test for the general population or a diagnostic test for a high-risk, symptomatic patient? The context changes everything.
Spotting these traps turns them from potential point-losers into easy wins.
Putting It All Together: A Final Checklist
To really nail this on exam day, run through this quick mental checklist for any question involving NPV. It helps you stay organized when the clock is ticking. For a deeper look at memory techniques like these, check out our post on effective study methods for memorization.
- Identify the Clinical Goal: Is the physician trying to rule a disease out? If yes, think NPV and sensitivity (SNOUT).
- Find the Prevalence: Scan the question for prevalence. If it's not there, you can't calculate predictive values. Period.
- Link Sensitivity to NPV: Connect the dots. A high sensitivity means fewer false negatives, which is the secret sauce for a trustworthy, high NPV.
- Check the Population: Does the clinical scenario match the population the test was designed for? A screening test's NPV is not the same for the general public as it is for a patient with textbook symptoms.
By internalizing these mnemonics and pitfalls, you move beyond rote memorization. You start developing the clinical intuition that separates the good test-takers from the great ones—a skill that will serve you on exam day and, more importantly, in patient care.
Answering Your Top Questions About NPV
Alright, let's tackle some of the common questions that pop up when you're trying to nail down Negative Predictive Value. Think of this as moving beyond the textbook formula and into the practical stuff you’ll actually need for exams and, more importantly, for clinical practice.
We'll break down what makes an NPV "good," how sensitivity and specificity pull the strings behind the scenes, and how to avoid a classic exam trap when comparing the NPV of two different tests.
What Is a Good Negative Predictive Value?
There's no single magic number, but in the real world of screening and ruling out serious diseases, you want an NPV that's as close to 100% as you can get. An NPV of 99% or higher is the gold standard—it gives you a ton of confidence.
For example, a study on kids with suspected pneumonia showed that a negative chest X-ray has an NPV of 99.7%. What does that mean? It means if a child's X-ray comes back clear, the chance they actually have pneumonia is incredibly slim. That’s a result a doctor can act on, confidently ruling out the diagnosis.
Now, flip that around. A test with an NPV of 80% is a different story. For a dangerous disease, that's not very helpful. It means that 1 out of every 5 patients with a negative result would still have the disease. That’s a level of uncertainty most clinicians aren't willing to accept.
The bottom line is this: The higher the stakes of missing a diagnosis, the higher the NPV needs to be for the test to be clinically useful as a rule-out tool.
How Do Sensitivity and Specificity Affect NPV?
Sensitivity and specificity are the two pillars that hold up a test's predictive values. While both matter, high sensitivity is the most direct driver of a high NPV.
Why? A highly sensitive test is fantastic at catching true cases of the disease, which means it produces very few false negatives. Remember the formula: NPV = TN / (TN + FN). When the False Negative (FN) number is tiny, the NPV gets a massive boost.
Specificity has a role, too. A highly specific test is great at correctly identifying healthy people, which increases your count of True Negatives (TN). While this also helps the NPV, the impact of minimizing those false negatives is usually much more powerful, especially when the disease isn't very common in the first place.
Can You Directly Compare the NPV of Two Tests?
This is a classic exam question designed to trip you up. The answer is a hard no. You cannot directly compare the NPV of two tests unless they were used in populations with the exact same disease prevalence.
Picture this: Test A has an impressive 98% NPV when used in a low-risk primary care clinic. Meanwhile, Test B has an NPV of 92% when used in a high-risk specialty unit where everyone is already suspected of having the disease.
It’s tempting to immediately say Test A is the better test, but that's a huge data interpretation error. Test B’s lower NPV is almost certainly a reflection of the high-prevalence population it was tested on, not a sign that the test itself is inferior.
Ready to stop memorizing and start understanding? Ace Med Boards offers personalized tutoring for the USMLE, COMLEX, and Shelf exams, helping you master biostatistics and other high-yield topics. Visit us at https://acemedboards.com to book a free consultation and see how our expert tutors can help you excel.
